

Every year, American homeowners waste hundreds of dollars on energy they never actually use — all because of hidden air leaks, insulation gaps, and drafts they can’t see with the naked eye. At Pixfra, we build thermal imaging technology that makes these invisible problems visible. In this case study, we’ll walk you through exactly how thermal devices are used in home energy audits and why this simple step can save you real money.
A home energy audit is a full checkup of how your house uses energy and where it wastes it. Think of it like a doctor’s visit — but for your home. A certified auditor comes in with specialized tools and examines everything from your walls and windows to your HVAC system and attic insulation. A certified pro inspects insulation, doors and windows, ductwork, and major systems — often using tools like blower doors and infrared cameras — to find where you’re wasting energy. The result is a prioritized roadmap that can lower utility bills, improve comfort, and boost indoor air quality.

The goal is simple: find out where your home is leaking energy and fix it. Making energy efficiency upgrades identified in a home energy assessment can save 5–30 percent on your monthly energy bill while also ensuring the health and safety of your house. That’s a big deal when you add it up over the course of a year or a decade. And the main tool that makes all of this possible? A thermal imaging camera.
Before we get into the details of the case study, let’s quickly talk about what makes a thermal device worth your time. If you want a deeper breakdown of the specs that actually matter, we’ve put together a full guide on the top 6 features needed in the best thermal device in 2026. It covers everything from NETD sensitivity to refresh rate — all the things that separate a good camera from one that gives you blurry, useless images.
Thermal imaging, also called infrared thermography, uses a special camera that picks up heat energy your eyes can’t see. Thermal imaging involves the use of infrared cameras to capture temperature variations in a home. These cameras detect heat emissions and create visual representations that highlight areas of energy inefficiency. Different temperatures show up as different colors on the screen — warm spots appear red, orange, or yellow, while cold areas look blue or purple. This color map lets you instantly spot where heat is escaping or cold air is sneaking in.

The process is non-invasive, which means nobody has to rip open your walls or tear up your floors. Thermal imaging is a non-invasive method for identifying energy inefficiencies. It’s a fast and efficient process that doesn’t require the removal of materials or causing any damage to your home. An auditor can scan an entire room in minutes and get a clear picture of what’s happening behind the drywall. You get results fast, and the process doesn’t disrupt your daily life at all.
For the best results, auditors typically look for a significant temperature gap between the inside and outside of your home. For reliable results, audits are usually conducted when there is a significant temperature differential (ΔT) — at least 18°F (10°C) between indoor and outdoor environments. This contrast helps reveal areas where heat is escaping or entering the building. That’s why winter and early morning are popular times for these inspections. But with the right equipment, you can run a scan at almost any time of year — especially if you pair it with a blower door test to push air through cracks and gaps artificially.
Here’s a real-world example that shows exactly why thermal devices matter for energy audits. A homeowner faced high heating bills despite installing a new furnace. A thermal imaging assessment revealed unsealed attic vents and insufficient wall insulation. After addressing these issues, the homeowner saw a 20% reduction in energy costs and significantly improved comfort during winter.
That’s the power of thermal imaging. The homeowner had already spent money on a new furnace, thinking that was the problem. But the real culprits — unsealed vents and thin insulation — were hiding behind the walls where no one could see them. A standard visual inspection would’ve missed these problems entirely. Only a thermal scan could pick up the subtle temperature differences that told the whole story.
This experience lines up with what we see across the industry. Numerous homeowners have witnessed significant improvements after inspections with infrared cameras. For instance, a case study in a suburban neighborhood revealed that homes undergoing infrared inspections identified hidden air leaks and insulation gaps. Time after time, thermal imaging catches things that other methods miss — and the fixes are often cheap and simple. Sealing a gap around a vent or adding insulation to a wall cavity doesn’t cost much, but the payoff on your energy bill is real and lasting.
Research backs this up too. In one study, householders who received a thermal image reduced their energy use at a 1-year follow-up, whereas householders who received a carbon footprint audit and a non-intervention control demonstrated no change. In a second study, householders were nearly 5 times more likely to install draught-proofing measures after seeing a thermal image.There’s something about actually seeing the heat leaking from your home that motivates you to act on it. Numbers on a report are easy to ignore. A glowing red streak showing warm air pouring out of your roof? That gets your attention.
So what exactly can a thermal camera find during a home energy audit? The list is longer than you might think.
The biggest one is poor insulation. Whether it’s missing, damaged, or just settled over time, bad insulation is a top cause of high energy bills. Poor insulation is a leading cause of high energy bills. Thermal imaging allows auditors to quickly spot inconsistencies in the thermal envelope — especially in attics, crawl spaces, and exterior walls — without disturbing the building materials.Blown-in insulation is especially prone to settling over the years, leaving cold spots that slowly drain your heating budget every winter.

Air leaks are another big one. Air leaks are one of the most common causes of energy loss in a home. Small gaps around windows, doors, vents, and ducts can allow warm or cool air to escape, forcing your HVAC system to work harder. These tiny gaps might seem harmless on their own, but add them all up and it’s like leaving a window open year-round. Addressing air leakage, which accounts for 25–40% of energy loss in typical homes, often delivers 10–20% savings in heating and cooling costs for a relatively modest investment of $300–$1,500.
Moisture problems are another thing thermal cameras catch. Thermal imagers are very effective tools for identifying moisture. Water has a high thermal capacitance, meaning that it efficiently absorbs and stores energy. The thermal capacitance of water or the effects of evaporative cooling (usually a 2°F to 5°F surface temperature difference) help reveal the extent of moisture damage, even when the surface feels dry to the touch. Left alone, moisture behind walls can lead to mold, rot, and even bigger repair bills down the road.
And then there’s your HVAC ductwork. Leaky ductwork causes the average home to lose 20–30% of its heating and cooling capacity. That’s a huge amount of energy you’re paying for but never getting. A thermal scan of your ducts can show exactly where the leaks are so you can seal them up.
Key findings thermal devices typically reveal during a home energy audit:
| Problem Detected | Common Locations | Typical Energy Loss | Average Fix Cost |
|---|---|---|---|
| Missing/settled insulation | Attics, walls, crawl spaces | 15–25% of heating/cooling | $500–$2,500 |
| Air leaks & drafts | Windows, doors, vents, outlets | 25–40% of total energy | $300–$1,500 |
| Ductwork leaks | Basement, attic, between floors | 20–30% of HVAC output | $300–$1,000 |
| Moisture intrusion | Behind walls, ceilings, basements | Reduces insulation R-value | $500–$3,000+ |
| Thermal bridging | Studs, lintels, slab edges | 5–15% of envelope loss | Varies |
Let’s talk dollars and cents — because at the end of the day, that’s what matters most.
The average homeowner saves $685 annually by implementing audit recommendations. It’s about having a clear roadmap for making your home better. At an average cost of $437 with payback in under 8 months, an audit is one of the smartest investments you can make in your home. That means you spend a few hundred dollars once, and you start saving every single month from that point forward.

The cost for home energy audits typically ranges from $300 to $600, with some advanced audits exceeding this range due to specialized tools and testing. The more detailed the audit — with blower door tests, infrared scanning, and full reporting — the higher the cost, but also the higher the payoff. And many utility companies and state programs offer discounts, rebates, or even free assessments to their customers, so your out-of-pocket cost could be a lot lower than you’d expect.
The return on investment here is hard to ignore. Acting on an audit typically cuts energy use 5–30%. On a $200/month bill, that’s about $120–$720 per year saved. With a $200–$700 audit, the fee often pays back within 1–3 years. And the savings keep coming year after year for as long as you live in the home. Unlike a lot of home improvement projects that are mostly about looks, an energy audit generates actual, measurable financial returns.
Not all thermal cameras are built the same, and when it comes to energy audits, the details in the device specs make a big difference. The most telling spec is NETD, which stands for Noise Equivalent Temperature Difference. It measures how sensitive the camera is to small changes in temperature. The lower the NETD value, the better the camera is at picking up subtle heat patterns — and subtle is exactly what you’re dealing with in a home energy audit, where a drafty window might only show a temperature shift of a few degrees.
At Pixfra, we build our thermal cameras with proprietary heat-detection technology. Our devices achieve NETD values of ≤18mK, which means they can pick up extremely small temperature differences with sharp clarity. That level of sensitivity is what separates a camera that gives you a blurry heat blob from one that shows you exactly where the problem is — down to the nail heads in your wall studs. As one home inspector put it: “the temperature differential does reveal what’s going on behind the wall” — and with the right device, those differentials are crystal clear.
Thermal sensitivity also plays a big role in detecting moisture, which is one of the sneakier issues thermal cameras can catch. Since wet materials cool down through evaporative cooling, the temperature difference is often just 2°F to 5°F compared to dry surfaces. A camera with poor NETD will miss that entirely. A camera with ≤18mK sensitivity will catch it every time. If you’re using a thermal device for any kind of home inspection or energy audit work, sensitivity should be at the top of your priority list — it’s the single spec that determines whether you find the real problems or just the obvious ones.
You’ve got two main options when it comes to thermal imaging for home energy audits: do it yourself or hire a pro.
Thermal imaging is available through professional services or DIY tools. Professional services use certified technicians with advanced equipment to conduct thorough energy audits and provide actionable insights. Affordable infrared cameras and smartphone attachments allow homeowners to conduct their own assessments. However, professional expertise is often necessary for accurate interpretation of results.

DIY thermal scans have gotten a lot more affordable in recent years. You can grab a smartphone-attached thermal camera for as little as $200, and it’ll give you a basic picture of where heat is escaping. It’s a great first step if you want to find obvious issues like major drafts around windows or completely missing insulation in your attic. But DIY has its limits. A DIY audit can show you that a window is drafty, but it can’t tell you the home’s total leakage rate or how it compares to building standards.
Professional audits, on the other hand, deliver the full picture. A certified energy auditor brings high-sensitivity thermal cameras, blower door equipment, and the know-how to read the results correctly. Energy auditors and weatherization professionals use thermal imaging because it provides a fast and easy way to pinpoint and document exact locations of problems. In an industry where speed and accuracy are vital, infrared allows for faster inspections and more detailed documentation. They’ll compile everything into a report with prioritized recommendations, so you know exactly what to fix first for the biggest savings. If you’re serious about cutting your energy bills, the professional route is worth every dollar.
Can thermal imaging really save money on energy bills?
Yes. Thermal imaging helps you find and fix hidden energy leaks that you’d never spot with your eyes alone. Once you seal air leaks, improve insulation, and fix ductwork issues, the savings show up on your energy bills right away. Homeowners who act on audit recommendations typically save 5–30% on their monthly energy costs, which adds up to hundreds of dollars every year.
What is the best time of year for a thermal energy audit?
Winter is usually the best time in most parts of the U.S. because the bigger the temperature gap between inside and outside, the easier it is for the thermal camera to pick up problems. However, you can get useful results in summer too — especially if you’re running the air conditioner. The key is having at least an 18°F difference between indoor and outdoor temperatures.
How much does a thermal imaging energy audit cost?
Most professional thermal energy audits cost between $300 and $700, depending on your home’s size and the level of detail involved. Many utility companies and state programs offer rebates or even free assessments. The average payback period is under 8 months, making it one of the best home investments you can make.
Can I do a thermal energy audit myself?
You can do a basic one with an affordable infrared camera or smartphone attachment. It’s good for spotting obvious drafts and insulation gaps. But for a full assessment with blower door testing, detailed thermographic analysis, and a written report with prioritized recommendations, hiring a certified professional is the way to go. Their equipment and training let them catch problems that DIY tools simply can’t.
What does a thermal camera actually show during a home energy audit?
A thermal camera picks up infrared radiation — heat energy — and displays it as a color-coded image on the screen. Warm areas show up as red, orange, or yellow, and cold areas appear as blue or purple. During an energy audit, this makes it easy to see where heat is leaking out of your home, where insulation is missing, and where cold air is getting in. It also picks up moisture intrusion and overheating electrical components.
Thermal imaging can help detect hidden moisture behind drywall because wet materials often appear cooler during evaporation or warmer when fed by an active hot-water leak. For detecting hidden moisture & mold risk behind drywall with thermal, treat the camera as a fast screening tool: it finds suspect areas, then a moisture meter confirms whether the wall is actually wet.
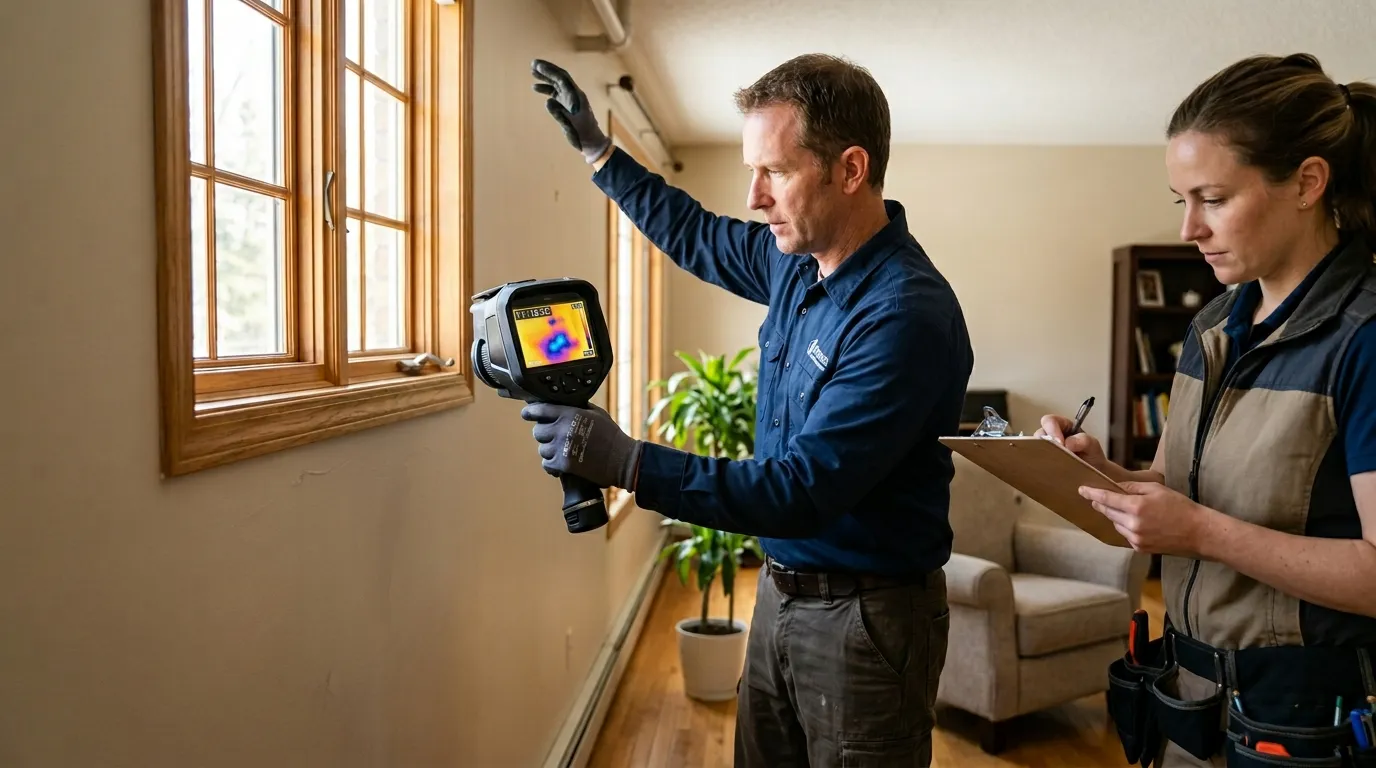
A thermal camera doesn’t see mold spores. It reads surface temperature. That distinction matters because a wet cavity can produce a clean thermal clue hours or days before staining, bubbling paint, or a musty odor becomes obvious. The camera gives you a map of where to test, not a lab result.
The mold part comes from moisture, time, and a food source. Drywall paper is food. A slow supply-line drip, roof leak, window flashing failure, AC condensate problem, or shower valve leak provides the water. The U.S. Environmental Protection Agency’s mold guide says moisture control is the core of mold control and recommends drying water-damaged areas within 24-48 hours to help prevent growth. That time window is why thermal scanning is useful: it can speed up the decision to open, meter, dry, or call a remediation pro.
No. Thermal cameras can’t identify mold species or confirm mold growth behind drywall. They can reveal temperature patterns that often come from wet gypsum, damp insulation, leaking pipes, or evaporation. If the pattern lines up with a water source, confirm it with a moisture meter before calling it mold risk.
The blunt answer to the Reddit version of this question is simple: thermal imaging sees the wet conditions that let mold grow. If someone points a camera at a wall and says, “that’s mold,” they’re skipping the proof step.
Wet drywall often looks cooler than surrounding drywall because evaporation pulls heat from the surface. Picture a bathroom wall behind a shower valve. The tile side looks fine. The hallway side has one soft blue-gray patch on the thermal display, starting at the valve height and feathering downward between studs. You touch it. It feels normal. The pinless meter says 28 percent wood moisture equivalent at the center and 10 percent two feet away. Now you have a target.
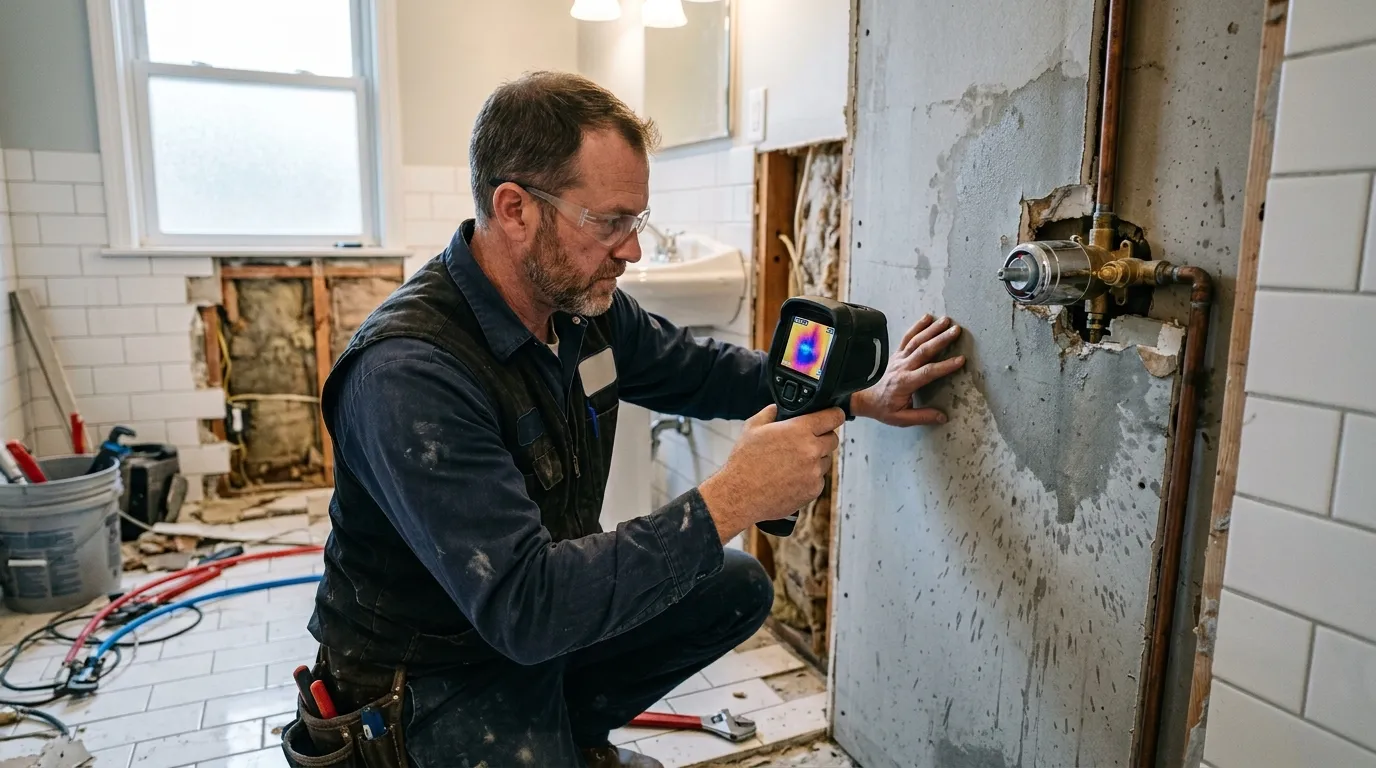
Hot-water leaks can flip the pattern. A leaking copper line behind 1/2-inch gypsum may show as a warm vertical stripe for 10 minutes after someone runs the shower. Once the flow stops, the same area can cool as damp materials evaporate. This is why one scan at 2 p.m. rarely tells the whole story. Run the suspected fixture, wait, scan, meter, then scan again.
| Thermal pattern | Common cause | Better next check |
|---|---|---|
| Cool blotch with soft edges | Evaporating wet drywall | Pinless meter grid |
| Warm line near floor | Hot-water pipe or radiant heat | Re-scan after fixture use |
| Cool vertical bay between studs | Wet insulation touching drywall | Pin probe or small inspection opening |
| Sharp straight stripe | Stud, corner bead, duct, or pipe | Compare with framing layout |
| Cool area at exterior corner | Air leak or missing insulation | Smoke pencil and humidity reading |
Wet drywall often looks cold because evaporation absorbs heat from the wall surface. The stronger the evaporation, the stronger the cooling pattern. High indoor humidity, vinyl wallpaper, low airflow, or a wall cavity packed with insulation can weaken that pattern, so thermal scans work best with meter confirmation.
The best readings usually happen when the room is stable and the wall has a temperature difference from its surroundings. In a U.S. home with air conditioning running, damp drywall near a plumbing leak may stand out by 2°F to 5°F. That isn’t a universal pass-fail number. A 2°F patch that repeats from three angles and matches a meter reading matters more than a 10°F reflection from a shiny picture frame.
Start with the story of the building. A one-story ranch in Phoenix with a flat roof fails differently from a 1998 Colonial in Ohio with upstairs bathrooms over a finished basement. Ask what changed: a new roof penetration, a frozen pipe last winter, a shower remodel, a dishwasher overflow, a musty closet after a humid week. Thermal imaging gets sharper when you already have a short suspect list.
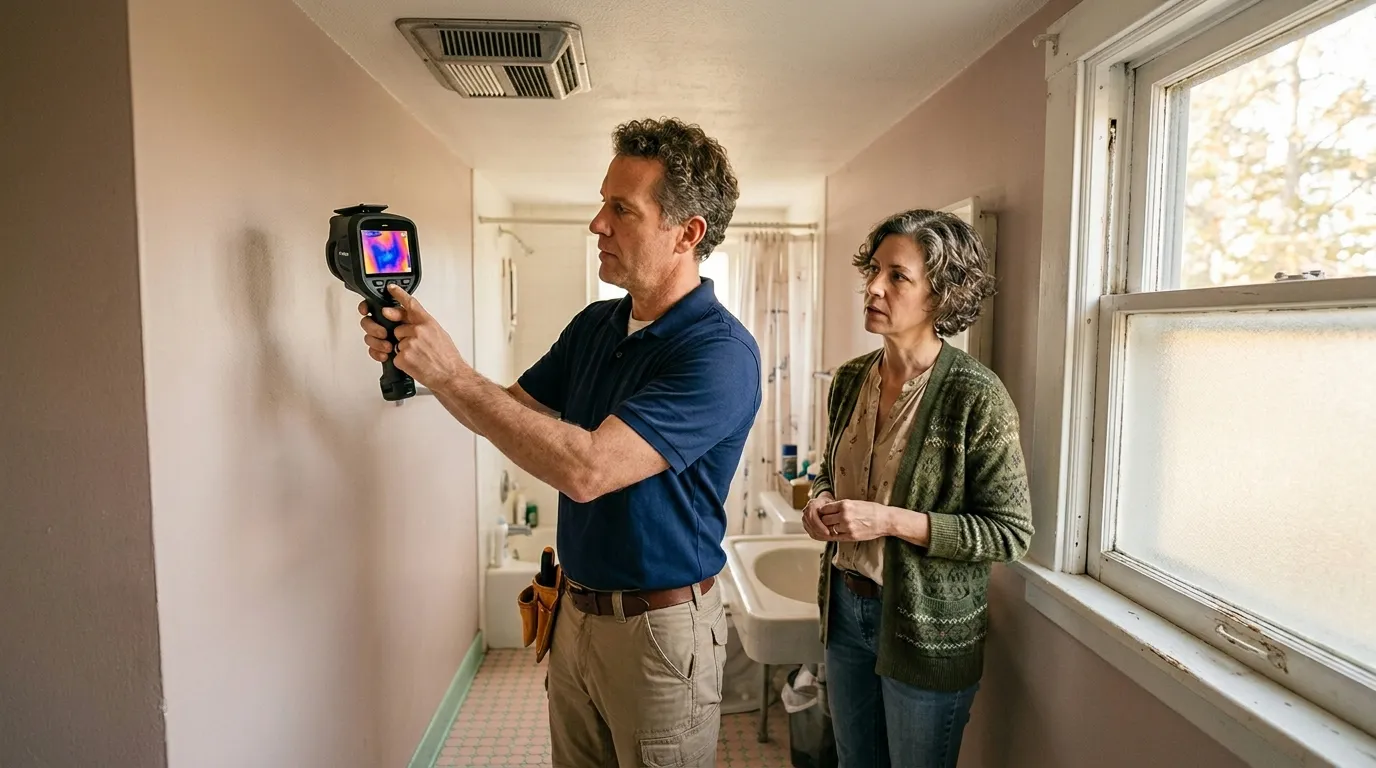
A practical scan works in passes. Stand back first, about 6 to 10 feet from the wall, so you can see the whole pattern. Then move closer for detail. Keep the camera perpendicular to the wall when possible. Avoid scanning across glossy tile, mirrors, stainless appliances, and glass because they reflect heat from your body, lights, and windows. If you’re using a Pixfra thermal device for a quick check, hold the view steady for a few seconds before calling the pattern real.
Use a simple field sequence:
If the cold pattern starts at the floor line or repeats along a hot-water run, the same logic used when plumbers locate slab leaks & radiant heating pipes with thermal applies: trace the heat path, confirm the wet zone, and avoid opening drywall until the pattern and meter reading agree.
Thermal can help trace active hot-water lines, radiant loops, and sometimes cold-water lines when the pipe temperature differs from the wall. It won’t map every pipe through drywall. Plastic PEX, deep cavities, insulation, and equalized wall temperatures can hide the line until water flow changes the temperature.
A moisture meter is still the closer. Pinless meters are faster and cleaner for painted drywall. Pin meters are better when you need depth clues or when the surface material is confusing the reading. For restoration work, a common pairing is a thermal scan plus a Protimeter Surveymaster, Tramex Moisture Encounter ME5, or Delmhorst BD-2100. The brand matters less than repeatable readings and a dry baseline.
False positives are common. Sun on an exterior wall can leave a warm rectangle that looks like a leak path. A supply register can chill a wall bay. A missing insulation batt can look like wet drywall because both create cold areas. Metal corner bead, screws, studs, and ductwork can create crisp thermal lines that don’t behave like moisture.
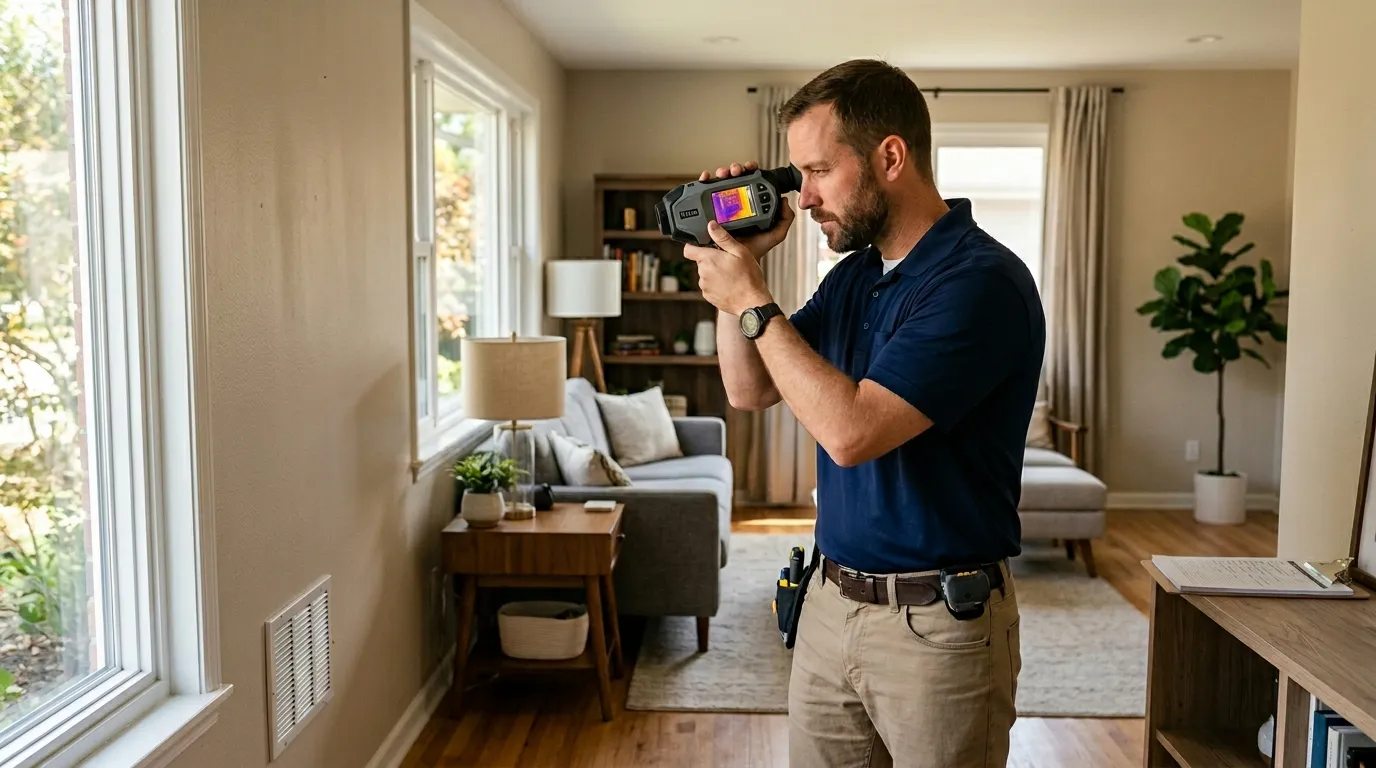
Reflections fool people fastest. A glossy painted wall can bounce the heat signature of your hand, a recessed light, or a sunny window behind you. Move left. Move right. If the “wet spot” moves with you, it’s reflection. Real wet drywall stays fixed to the wall geometry.
Field rule: a suspect moisture pattern should pass at least four checks before you treat it as real.
Thermal work also overlaps with pest inspections; when a warm wall patch moves, contains nesting material, or follows an attic entry point, this is closer to thermal imaging for pest control pros than a moisture call. Moisture patterns spread, wick downward, and follow absorbent materials. Animal heat behaves differently. So does a live electrical load.
Once you confirm moisture, the next question is risk. The Centers for Disease Control and Prevention’s mold page says mold can grow where moisture is present and notes that people with asthma, mold allergies, immune compromise, or chronic lung disease can have stronger health reactions. That doesn’t mean every cold patch is an emergency. It means you should match the response to the size, water source, occupant risk, and time wet.
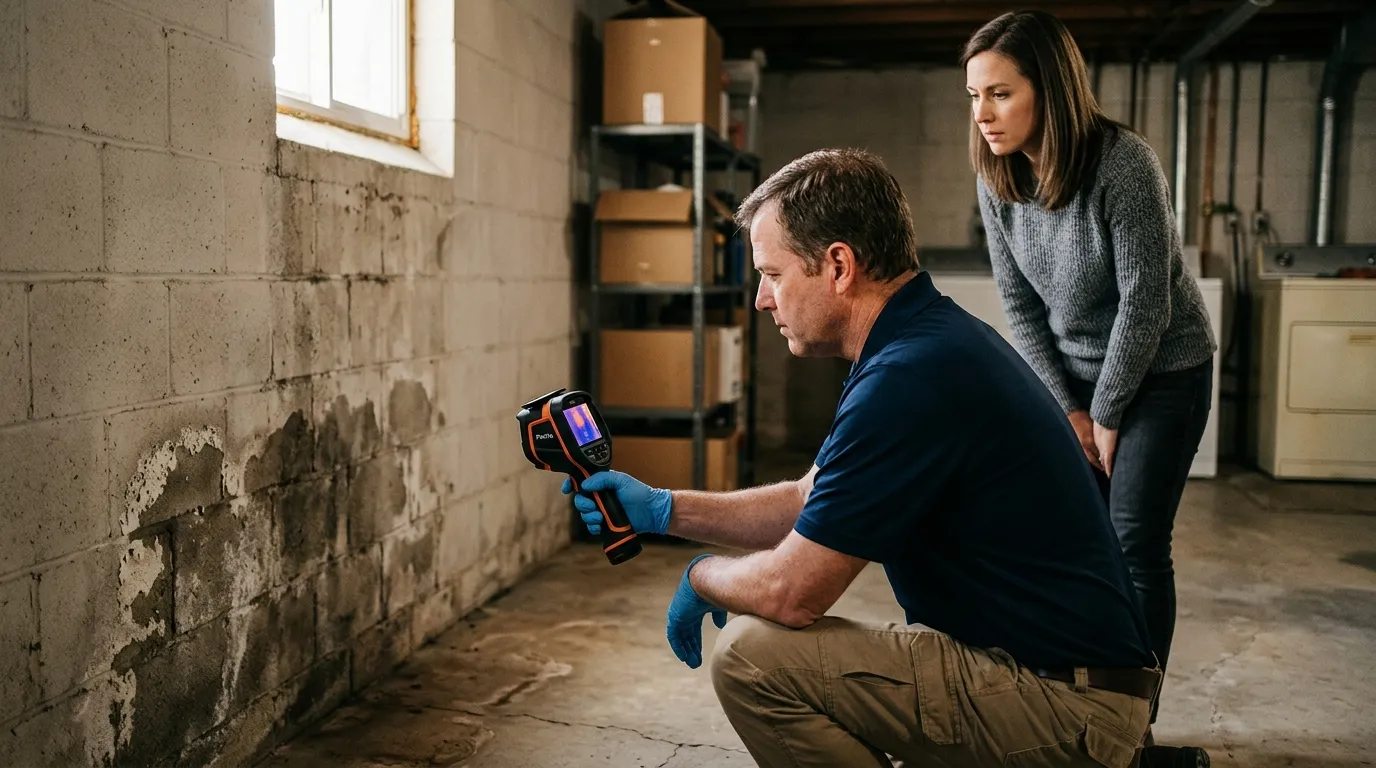
Small, clean-water leaks caught early are usually a drying problem. A toilet overflow from a clean tank is one thing. Sewage, floodwater, long-term wall cavity moisture, or a musty odor with occupant symptoms is a different call. Don’t let a pretty thermal image soften that distinction.
| Situation | Thermal value | Best decision |
|---|---|---|
| Leak less than 24 hours old | Finds wet perimeter fast | Stop water and dry aggressively |
| Leak 2-7 days old | Maps likely mold-risk zone | Meter, open if readings stay high |
| Musty odor, no visible stain | Finds hidden suspect areas | Inspect cavities with care |
| Sewage or floodwater | Limited screening value | Call a qualified remediation pro |
| Mold over about 10 sq. ft. | Helps define spread | Follow professional cleanup guidance |
Open drywall when moisture readings stay high, the water source is confirmed, the wall smells musty, paint is soft, or the cavity contains contaminated water. Don’t open a wall just because a thermal image looks odd. Meter it, compare it, and document why that exact spot is the right cut.
Behind drywall, mold risk climbs when drying can’t reach the wet material. Closed cavities, vinyl wallpaper, wet fiberglass insulation, double drywall, and baseboards with trapped water slow evaporation. A dehumidifier in the room may make the surface look better while the paper backing stays wet. That’s one of the sneaky parts.
For homeowners, the line is usually safety and scale. A 12-inch patch under a small supply leak may be manageable if you stop the water fast and dry the wall. A 6-foot run behind kitchen cabinets with swelling baseboard is contractor territory. If anyone in the home has asthma or immune compromise, move sooner.
Good documentation turns thermal imaging from “I saw something weird” into a defensible moisture map. Take a normal photo and a thermal photo from the same position. Mark the wall. Note the date, room, fixture tested, indoor temperature, relative humidity, and meter readings. Use the same color palette for the job so the photos don’t exaggerate the change from room to room.
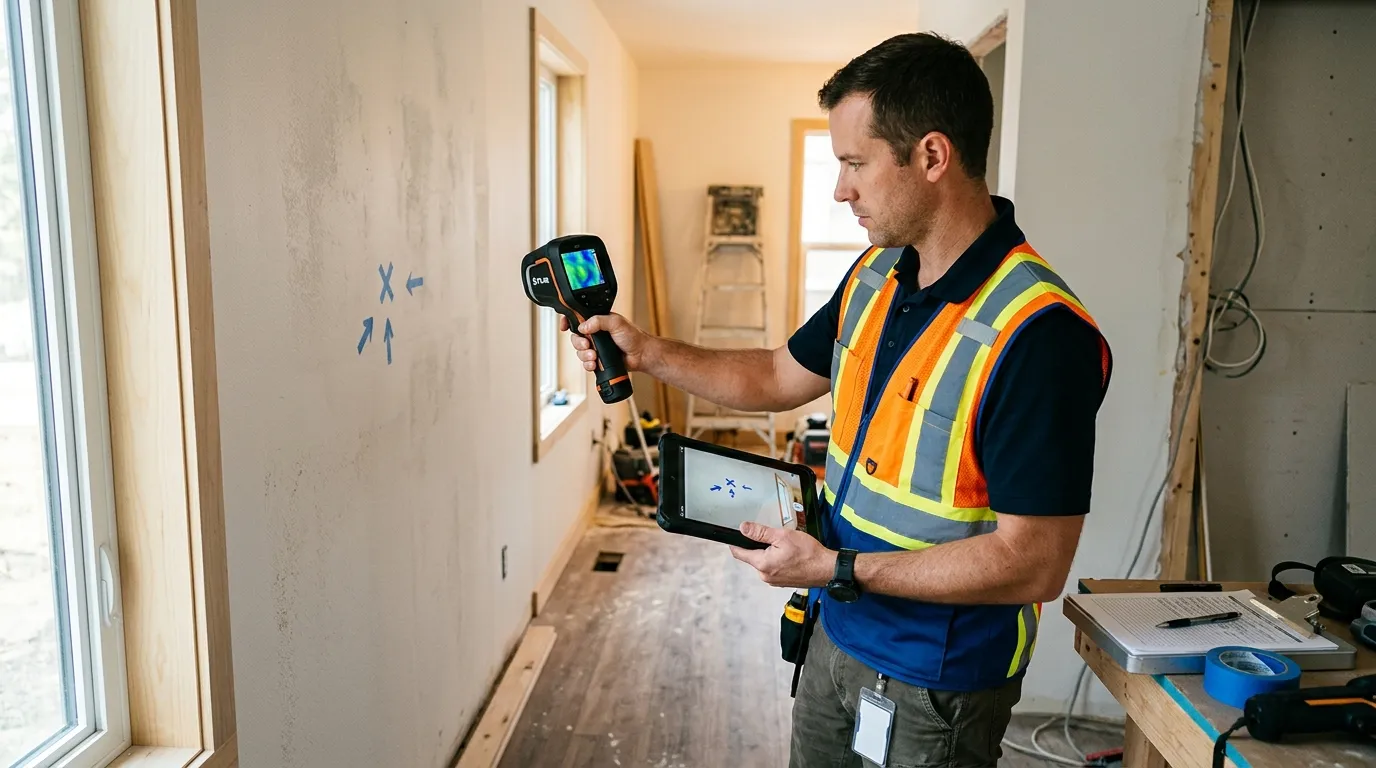
Don’t chase perfect images. Chase repeatable evidence. A slightly blurry thermal photo with a clear tape mark, meter number, and dry control reading beats a dramatic rainbow image with no context. Insurance adjusters, landlords, tenants, and restoration crews all need the same thing: where is wet, how wet is it, and what caused it?
For detecting hidden moisture & mold risk behind drywall with thermal, use this job note format:
Then come back. A drying job without follow-up is a guess. Re-scan after 24 hours and again when the meter reads close to the dry control area. If the thermal pattern shrinks and the meter drops, you’re moving in the right direction. If the surface looks dry but the meter stays high, the wall is still holding water.
No. Thermal imaging marks suspicious surface temperature patterns; a moisture meter, probe, or controlled inspection opening confirms wet drywall.
A 2°F to 5°F difference can matter when it follows a leak-shaped pattern and repeats from several angles. Single pixels or sharp stripes near studs are weak evidence.
Yes, flat or eggshell paint is usually fine. Gloss paint, foil wallpaper, tile, glass, and mirrors can reflect heat and distort results.
Usually no. CDC says if you see or smell mold, remove it and fix the moisture source; testing isn’t needed for most homes.
EPA recommends drying water-damaged areas within 24-48 hours to help prevent mold growth. Wet drywall left closed for days deserves a closer inspection.
Pixfra builds thermal devices for people who need to read heat patterns clearly, whether they’re outdoors at night or checking a suspicious wall inside a property. For detecting hidden moisture & mold risk behind drywall with thermal, the win is disciplined scanning: find the pattern, confirm the moisture, stop the water, and document the dry-out.
