

The thermal imaging space in 2026 is moving fast — faster than most people realize. The global thermal imaging market is projected to grow from about $4.6 billion in 2023 to $7.6 billion by 2030. If you’re a hunter, wildlife watcher, or someone who just wants to see more in the dark, these shifts hit close to home. We’re Pixfra, and we build thermal monoculars, scopes, front attachments, and multispectral binoculars for the real outdoors. In this post, we’re breaking down the seven new thermal device technologies you need to have on your radar right now — and what they mean for your next purchase.
Before you read on, it’s worth knowing what features actually make the best thermal device in 2026. That piece covers the hardware side. This one is all about where the tech is headed — and how it’s already changing what you get in the field.
If there’s one tech trend that’s reshaping thermal devices more than anything else in 2026, it’s artificial intelligence. The integration of artificial intelligence into thermal imaging systems represents perhaps the most significant shift in how organizations deploy and operate infrared technology. But what does that actually mean for you when you’re out in the field at 2 AM?

In plain terms, AI-enhanced image processing takes the raw heat data your sensor picks up and makes it sharper, cleaner, and easier to read — all in real time. SharpIR AI-enhanced imaging dynamically sharpens edges, improves contrast, and enhances target definition in real time. We’re not talking about a filter you apply after the fact. The device itself is constantly analyzing every frame and adjusting the picture. That means when you zoom in digitally on a target at 400 yards, the image doesn’t just get bigger and blurrier — AI algorithms work to maintain edge definition and reduce noise so you can still tell a coyote from a stump.
This tech also ties into smarter scene recognition. AI deep learning intelligently suppresses noise and interference. It analyzes each captured frame in real-time, adapting the optimal algorithm based on different scenarios to enhance the dynamic range of the image. This not only makes the image clearer and sharper but also highlights the targets more prominently. For hunters and outdoor users, that’s a real-world advantage — not a marketing bullet point. At Pixfra, our proprietary heat-detection technology already delivers ≤18mK NETD sensitivity across our device lineup. Pairing that level of sensor performance with AI-driven processing is where thermal imaging goes from good to game-changing.
And this isn’t a feature reserved for $5,000+ scopes anymore. AI-enhanced image processing and smartphone integration will expand capabilities while maintaining current price points. Across the industry, AI-powered thermal imaging is filtering down to mid-range models, which means more of you will get access to it without breaking the bank.
Sensor sensitivity has always been the backbone of a good thermal device. NETD — Noise Equivalent Temperature Difference — tells you the smallest temperature change a sensor can detect. The lower the number, the sharper the picture when conditions get tough: think heavy fog, rain, or a warm summer night where everything is radiating at similar temperatures.
In 2026, the bar has moved. The industry’s latest high-sensitivity thermal sensors offer performance down to sub-15 mK NETD, paired with high-transmission germanium optics that maximize light throughput and detection capability. Two years ago, ≤25mK was solid. Now the premium standard is pushing below 15mK, and what used to be high-end sensitivity — like the ≤18mK that our Pixfra devices deliver — sits comfortably in the sweet spot between performance and price.
Why does this matter to you? Because when you’re scanning a treeline in humid summer air, or trying to pick up a bedded deer at 300 yards in a light rain, those extra millikelvins of sensitivity are the difference between seeing a clear outline and squinting at a blob. A sub-20mK unit can detect temperature differences as small as 0.018°C, revealing animals through heavy brush that would be invisible to units with 50mK+ ratings. The difference between 18mK and 40mK sensitivity is dramatic when tracking wounded game or detecting partially concealed targets.
Across our Pixfra lineup — from the Mile 2 series to the Sirius HD — we pair ≤18mK sensors with 12μm pixel pitch for sharp, high-contrast images. That combination gives you crisp detail at every zoom level, even in challenging conditions that would wash out less sensitive devices.
Sensors are getting smaller — and that’s a good thing. Sensor miniaturization has driven pixel sizes from 35μm down to 10μm or smaller, enabling more compact form factors without sacrificing resolution. A smaller pixel pitch means you can pack more pixels onto the same sensor, which gives you higher resolution in a device that doesn’t weigh you down.

The 12μm pixel pitch has become the standard across serious thermal devices in 2026. It’s the sweet spot that lets manufacturers build compact, lightweight units with enough resolution to identify targets at real-world distances. Our Pixfra devices use 12μm pixel pitch technology across the board — from entry-level models to our pro-grade Sirius HD series — so you get sharp detail no matter which price tier you’re shopping in.
This miniaturization also feeds directly into lighter, more ergonomic designs. Our Draco series, for example, was built around a lightweight platform specifically for hunters who need multi-functional performance without the bulk. When you’re carrying a device for hours on a cold night, every gram counts. Shrinking the sensor means shrinking the optics housing, the battery requirements, and the overall weight — while actually improving image quality. That’s the kind of engineering trade-off that only happens when the underlying sensor tech takes a real step forward.
One of the most exciting thermal device technologies gaining traction in 2026 is multispectral imaging — combining thermal data with other sensor bands in a single unit. Multi-spectral fusion combines thermal with low-light or digital night vision for superior situational awareness. Instead of carrying two devices (a thermal monocular for night and a standard optic for day), you get one device that handles both.

Organizations with diverse operational requirements are increasingly turning to multi-sensor imaging platforms that combine different spectral capabilities. Rather than deploying separate systems for different scenarios, multi-band solutions provide flexibility to address varying target temperatures, atmospheric conditions, and mission profiles with a single platform.
We built our Pixfra Volans series around this exact concept. The Volans features all-day vision capability with an adjustable aperture from F1.2 to F3.0 to adapt to different lighting conditions, making it one of the few thermal devices on the market that performs just as well in broad daylight as it does in total darkness. You carry one device instead of two. That kind of versatility used to be restricted to military-grade gear. Now it’s in the hands of hunters and outdoor enthusiasts.
For hunters in states where thermal use is legal for predator control at night but who also want a capable optic for daytime scouting, this is a no-brainer. And for wildlife observers who track animal activity across dawn and dusk transition periods, a multispectral system means you never have to swap devices during the golden hour when animals are most active.
The trend toward all-in-one thermal systems keeps accelerating. Built-in laser rangefinders, onboard audio and video recording, Wi-Fi streaming, and companion app ecosystems are increasingly standard on serious devices rather than premium additions. The best thermal imaging monocular options in 2026 deliver an entire field toolkit in a single unit.
A built-in laser rangefinder (LRF) gives you exact distance to your target at the press of a button. No fumbling for a separate device in the dark. For hunters taking shots beyond 150 yards at night, an integrated LRF is the line between confidence and guesswork. Our Pixfra models with LRF capability — the Arc LRF, Chiron LRF, and Taurus LRF — all pack 1,000-meter range in a single unit. The Chiron LRF and Taurus LRF take it further with built-in ballistic calculators that compute bullet drop and give you an adjusted aiming point on the fly.
This technology trend speaks to something bigger: thermal devices are no longer just observation tools. They’re complete targeting systems. Next-generation thermal imaging riflescopes include precision laser ranging, AI ballistic calculation, and a true open display for situational awareness — day or night, without compromise.The devices shipping in 2026 replace what used to be three or four separate pieces of gear. And the data these integrated systems produce — from range readings to ballistic solutions — feeds directly into companion apps for documentation, sharing, and post-hunt analysis.
Here’s a quick look at how integrated features stack up across different use scenarios in 2026:
| Feature | Casual Use / Short Hunts | Serious Night Hunting | Professional / Law Enforcement |
|---|---|---|---|
| Laser Rangefinder | Nice to have | Must-have | Must-have |
| Ballistic Calculator | Not needed | Highly recommended | Must-have |
| Wi-Fi / App Connectivity | Nice to have | Recommended | Must-have |
| Onboard Video Recording | Nice to have | Recommended | Must-have |
| Picture-in-Picture | Not needed | Nice to have | Recommended |
Build quality isn’t a flashy spec, but it’s one of the technologies that’s quietly gotten a lot better in 2026. The combination of lightweight materials and high-grade environmental sealing means you don’t have to choose between a device that’s easy to carry and one that can survive real conditions.
IP67 is the gold standard right now. It means full dust sealing and protection against temporary water submersion — enough to handle rain, stream crossings, snow, and those “oops” drops into a puddle. Some cheaper devices still ship with IP54 ratings, which cover splashes but won’t survive a real dunking. If you hunt in any kind of weather (and let’s be honest — when do you not?), IP67 is non-negotiable.
At Pixfra, we build our devices for the same conditions we use them in. Our thermal scopes handle heavy recoil. Our monoculars survive drops. Our housing materials resist corrosion over years of use. Weight plays a role here too — a thermal device that’s too heavy will wear you out during long sessions, messing with your aim and your patience. That’s why models like our Draco series prioritize lightweight builds for multi-functional performance without the bulk.
Ergonomics tie into this as well. Cold, gloved hands at 2 AM in a hunting blind don’t mix well with complicated menus or finicky buttons. If you can’t operate your thermal device with one hand in the dark while wearing gloves, the design has failed. Simple, accessible controls across every device in a lineup is what separates field-tested gear from lab-tested gear.
The last technology on our list might surprise some people, but it’s one of the fastest-growing differentiators in thermal devices: software. The integration of thermal imaging systems with smart technologies and the Internet of Things (IoT) is emerging as a significant trend. This convergence allows for enhanced data collection and analysis, enabling real-time monitoring and decision-making.

The best thermal devices in 2026 don’t just show you a heat image — they connect to your phone, record video, stream live footage, and update their own firmware over the air. Our Pixfra Outdoor App supports all our current models, including the Sirius, Arc LRF, Mile 2, Pegasus Pro, Chiron LRF, Taurus, and Taurus LRF series. Through the app, you can update firmware, adjust settings, and transfer images and video directly to your smartphone. That kind of connectivity is more than a convenience — it’s a tool for documenting hunts, sharing scouting data with hunting partners, or keeping records of wildlife activity on your property.
Over-the-air firmware updates are especially big. Instead of your device being locked into the feature set it shipped with, OTA updates let manufacturers push improvements — better image processing, new color palettes, bug fixes, even new features — directly to your device. It’s how phones have worked for years, and it’s finally standard in thermal optics. When you buy a Pixfra device, you’re not just buying today’s feature set. You’re buying a platform that gets better over time.
Color palettes are another smart feature that experienced users swear by. White Hot, Black Hot, Red Hot, Iron Bow, and Rainbow modes each serve a specific purpose depending on terrain, weather, and personal preference. Multiple palette options let you adapt your display on the fly without changing the detection ability of the device itself.
How does AI improve thermal imaging devices in 2026?
AI processes each frame from the thermal sensor in real time, sharpening edges, reducing noise, and boosting contrast — especially at longer ranges or when you’re zoomed in digitally. The result is a clearer, more detailed picture that helps you identify targets faster and more accurately, even in bad weather or cluttered backgrounds.
What NETD should I look for in a thermal monocular?
For hunting, wildlife observation, and general outdoor use, look for an NETD of ≤25mK or lower. Devices with ≤18mK — like the Pixfra lineup — deliver crisp images even in challenging conditions like fog, rain, or total darkness. The lower the number, the better the sensor picks up small heat differences between a target and its background.
Is a built-in laser rangefinder worth it on a thermal scope?
Yes — especially if you’re hunting at distances beyond 150 yards or shooting at night. A built-in LRF gives you instant distance data without carrying a second device. When paired with a ballistic calculator (like in our Chiron LRF and Taurus LRF), you get a complete targeting solution that computes bullet drop and gives you an adjusted aiming point.
Can thermal devices be used during the day?
Thermal devices detect heat, not light, so they work around the clock. Some models, like our Pixfra Volans series, go even further with all-day vision capability and an adjustable aperture (F1.2–F3.0) that adapts to changing light conditions — making them a strong pick for 24-hour coverage from a single device.
What’s the difference between detection range and identification range?
Detection range tells you how far out a device can spot any heat signature. Identification range — where you can confirm what you’re seeing — is always shorter. A device might detect heat at 1,500 meters, but you might only be able to tell if it’s a deer or a stump at 600 meters. Always check both numbers before you buy.
Using thermal for data center uptime gives you a fast way to see heat problems before they turn into load loss: rack hot spots, weak PDU terminations, UPS battery heat, and cold-aisle air leaks. Use it as a scheduled inspection and a post-change check, because sensor dashboards often tell you a rack is warm after the airflow pattern has already changed.
Thermal for data center uptime means using a handheld thermal camera to trend rack inlets, server exhaust, PDUs, UPS cabinets, busway joints, panels, CRAC/CRAH supply paths, and return air. It catches abnormal heat before alarms trip: loose terminations, overloaded whips, blocked tiles, missing blanking panels, and recirculated hot air.
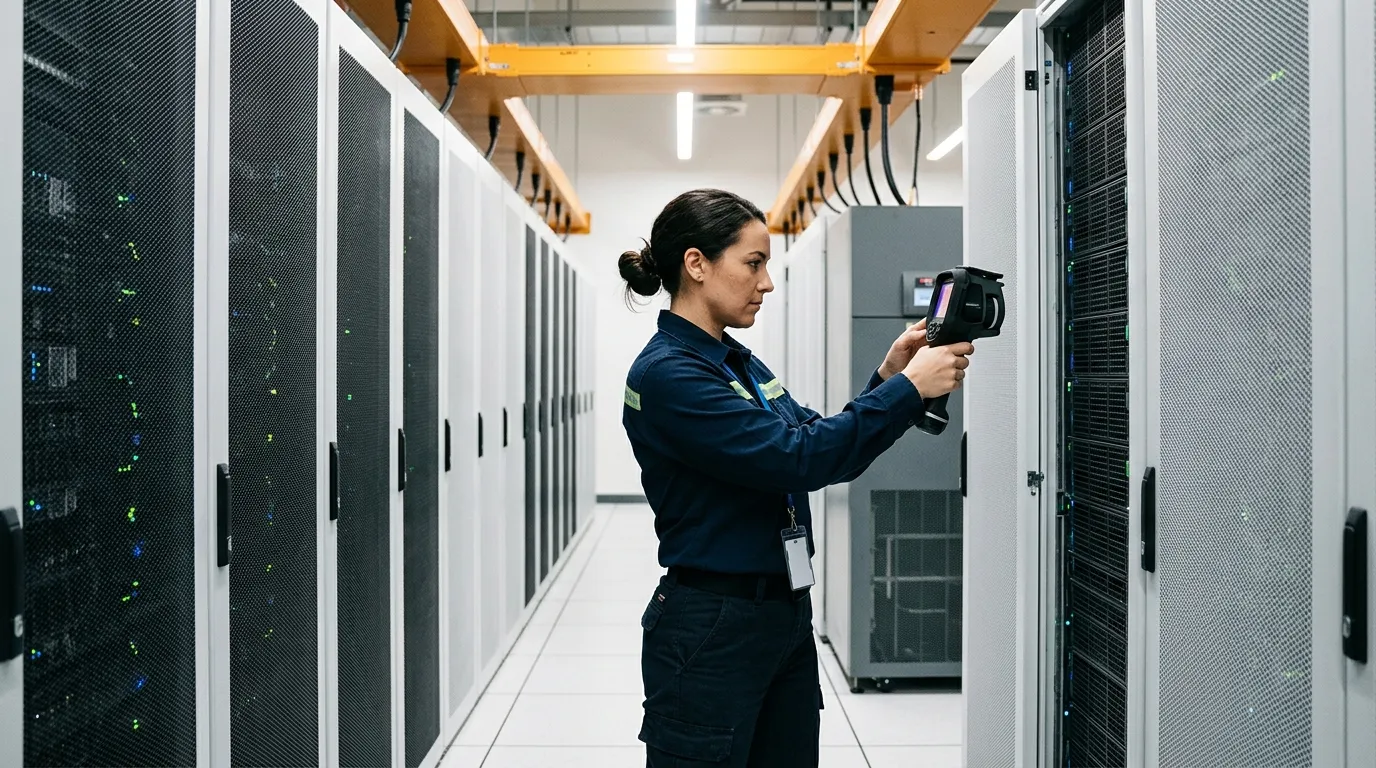
Walk into a data hall after a Friday change. Two 42U racks were re-cabled, one perforated tile moved 18 inches, and a blanking panel disappeared because someone needed “temporary” access. The BMS still looks fine. Server inlet sensors look acceptable too, mostly. But a thermal scan from the cold aisle shows one rack face with a warm vertical stripe on the right side. That stripe is hot-aisle air being pulled around a gap, and it’s the kind of thing you want to see before Monday’s batch jobs hit.
That’s where thermal imaging earns its place beside DCIM, branch-circuit monitoring, and inlet probes. The ASHRAE TC 9.9 data center resource page points operators toward data center standards and guidance on cooling, energy, humidity, and power equipment. Uptime Institute’s Annual Data Center Outages Analysis 2026 also frames outage prevention around higher system complexity, AI-driven workloads, power constraints, grid instability, and co-dependencies. Translation for the person carrying the pager: the room is getting harder to read by gauges alone.
| Scan Target | What Thermal Shows | First Response | Owner |
|---|---|---|---|
| Rack fronts | Inlet hot spots, side recirculation, blocked airflow | Add blanking panels, adjust tiles, check containment | Facilities + IT |
| Rack rears | PSU heat, cable congestion, exhaust imbalance | Clear cable mats, check fan status, compare load | IT operations |
| PDUs / UPS | Warm breakers, lugs, outlets, battery strings | Create electrical work order, verify load, inspect safely | Electrical |
| CRAC / CRAH paths | Supply variation, failed coils, bypass air | Check setpoints, valves, dampers, filters | Mechanical |
A thermal camera won’t replace alarms. It changes when you find the problem.
Rack hot spots usually start as shape problems, not temperature problems. A top-of-rack switch exhausts into a gap. A dense 2U GPU node sits above low-power storage. A brush grommet is missing behind the cabinet. The front of the rack doesn’t look “hot” to your eyes, but the thermal image shows a warm plume curling into the cold aisle like smoke.
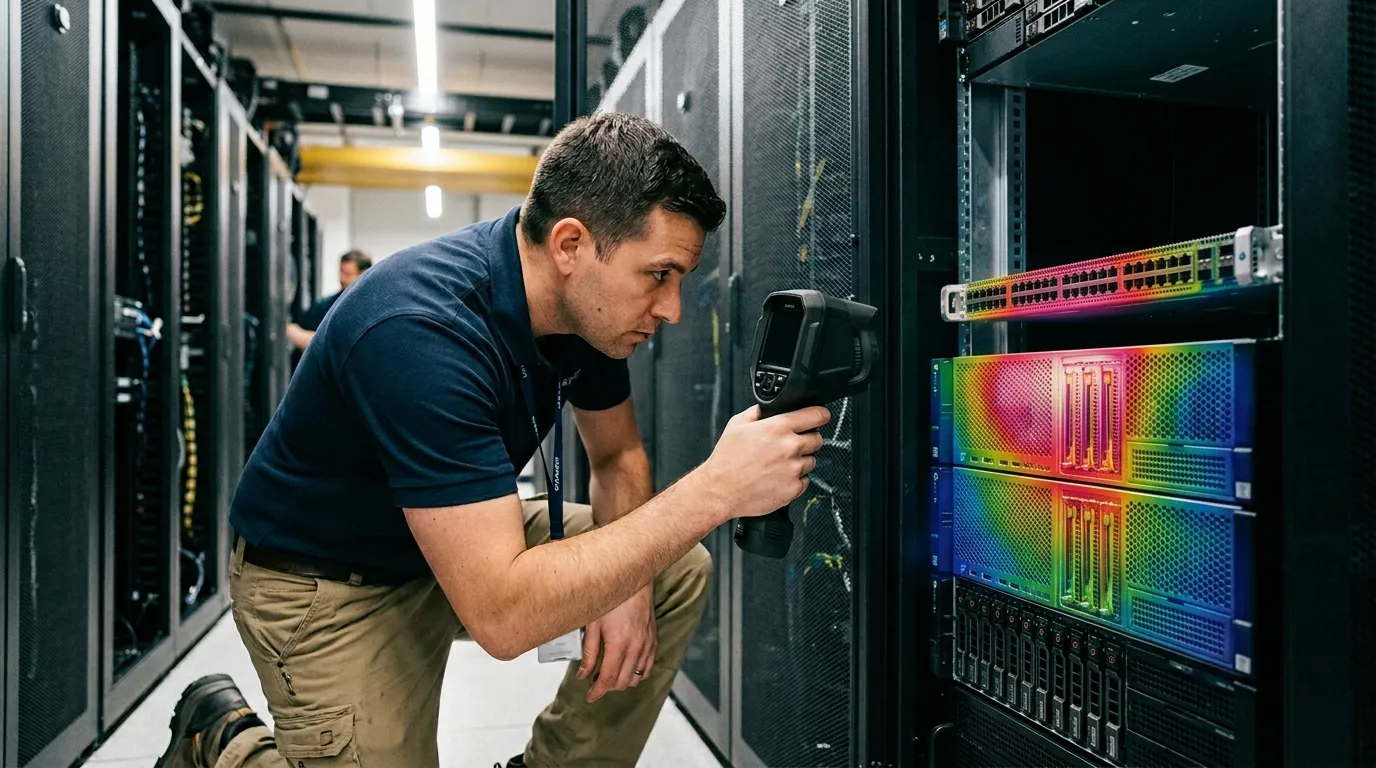
Use the rack face as your first truth source. ASHRAE’s commonly used recommended inlet range for many IT equipment classes is 64.4°F to 80.6°F, but a single number can mislead you. A rack inlet at 76°F may be fine. A 76°F vertical stripe beside 66°F neighboring inlets tells you air is going somewhere it shouldn’t. For high-density rows with NVIDIA H100 or H200 servers, Dell PowerEdge XE9680 systems, Supermicro GPU servers, or HPE Cray XD nodes, compare by zone and workload. Thermal imaging sees surface patterns; it won’t measure GPU junction temperature inside the chassis.
Scan close enough to fill the frame with the target. Across-the-room scans look dramatic and often tell you very little. A good rack scan is boring: front face, rear face, cable openings, floor tiles, containment edges. The same temperature-pattern thinking that helps plumbers locate slab leaks & radiant heating pipes with thermal also helps data center teams read hidden air paths under raised floors and behind cabinets.
Rack scan pattern:
Don’t chase every warm patch. A rear exhaust plume is supposed to be warm. A warm patch on the cold side deserves attention when it differs from neighboring racks under similar load, appears after a change, or grows between scans.
Electrical hot spots deserve faster action than ordinary airflow issues. A rack inlet problem may give you hours or days. A loose termination inside a power path can become a burned connector, nuisance trip, or maintenance emergency. Thermal imaging is especially useful on repeatable components: Raritan PX3 rack PDUs, Schneider Electric NetShelter switched PDUs, APC Smart-UPS SRT units, Eaton 9PX systems, Vertiv Liebert GXT5 units, Starline busway tap boxes, and Square D panelboards.
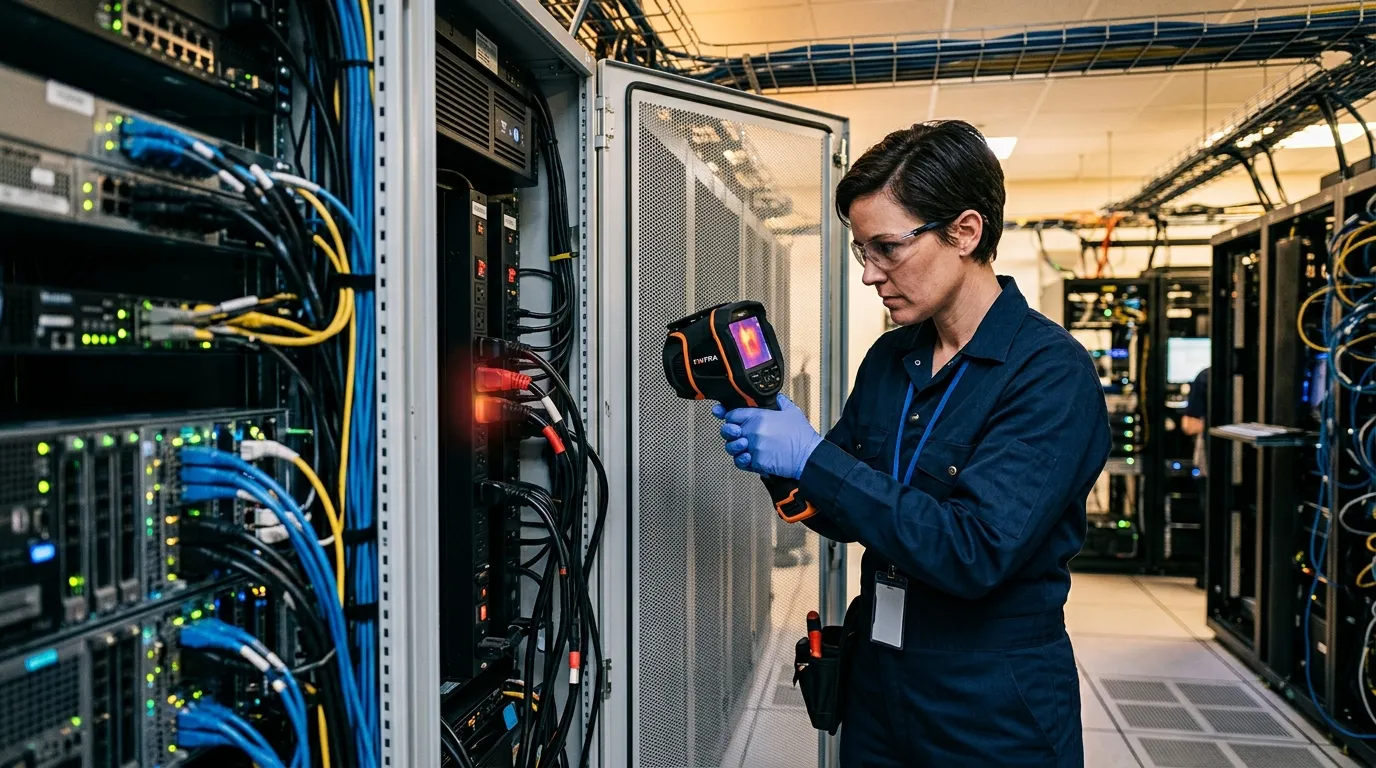
Compare like with like. One C19 outlet feeding a 2.8 kW server will run warmer than a lightly loaded outlet, so the useful question is whether that outlet is hotter than another outlet carrying a similar load. On three-phase gear, compare phase conductors, breaker bodies, whips, plugs, and lugs under normal load. If A-phase looks 18°F warmer than B and C on similar current, don’t shrug it off. Write it down, attach the thermal image, and give the electrician enough context to inspect the right point.
Safety comes first here. NFPA 70B covers electrical equipment maintenance, and NFPA 70E covers workplace electrical safety practices. A thermal camera is a diagnostic tool. It isn’t permission to open energized panels without a qualified person, PPE, arc-flash boundaries, and site procedure. If your facility uses IR windows on switchgear or UPS cabinets, use them. If it doesn’t, scan what you can see from a safe position and escalate when the pattern justifies it.
| Thermal Pattern | Likely Cause | Action Window | Field Note |
|---|---|---|---|
| One PDU outlet bank hotter than peers | Overload, weak plug contact, poor cable seating | Same shift | Verify amps before moving load |
| One breaker warmer than matching breakers | Loose termination or high load | Same day | Electrical review, no guessing |
| UPS battery block warmer than neighbors | Weak cell, charging issue, ventilation problem | Same day | Compare against UPS logs |
| Busway tap box hot at joint | Contact resistance, installation fault | Immediate review | Keep distance and document |
For colocation rooms, make the evidence tenant-neutral. “Cabinet B14 rear PDU outlet group, 14°F above adjacent group at 2:13 p.m., normal load per PDU display” gets a better response than “PDU looks hot.” Specific beats dramatic.
Airflow problems hide in averages. A cold aisle sensor at 72°F can sit in a perfectly acceptable pocket while a server at the top right of Rack C07 inhales 83°F air. Thermal imaging helps you see the pattern across the aisle, not just the sensor point. That matters when teams are trying to raise setpoints, add AI racks, or reduce fan energy without creating silent thermal debt.
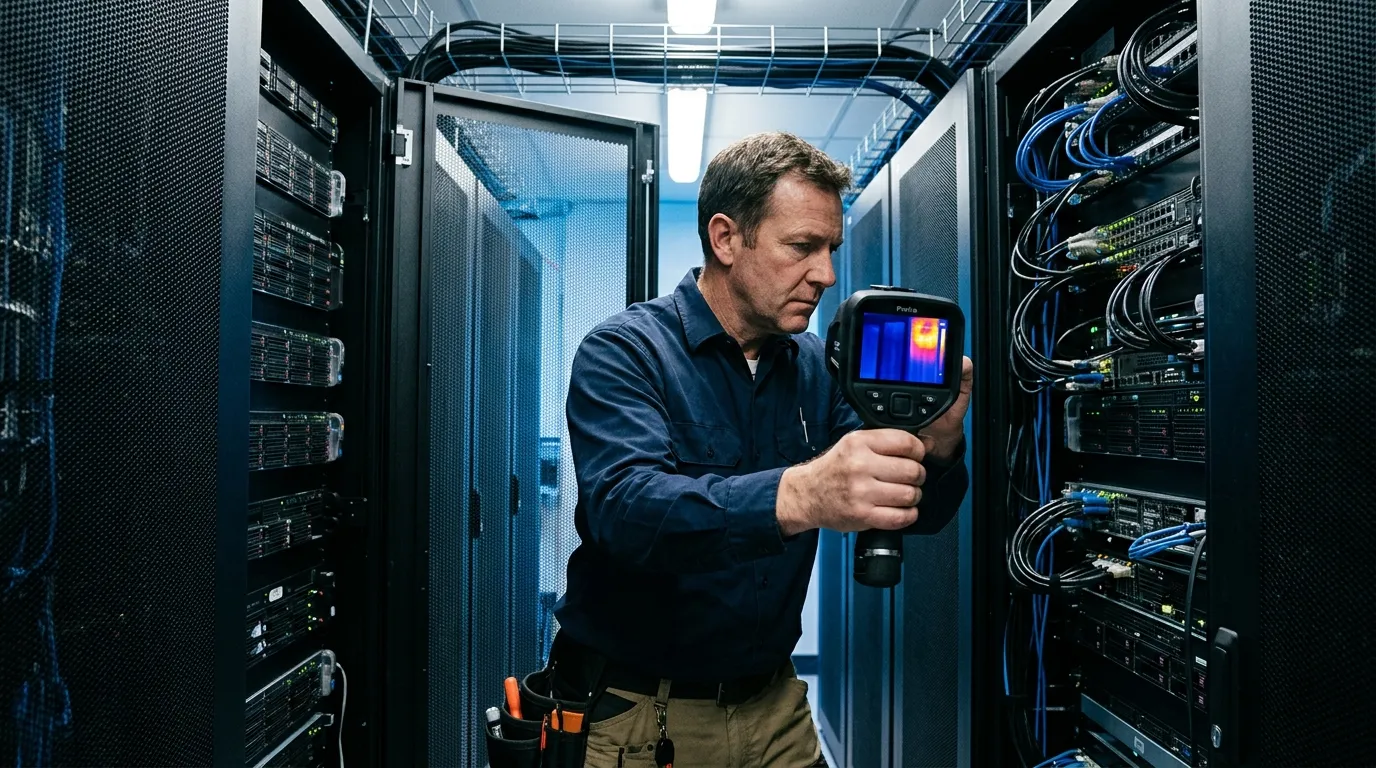
Start with cold-aisle symmetry. The rack faces should look even from bottom to top, with expected variation near high-density gear. If the top third of several racks reads warmer, you may have return-air spillover above containment. If every other rack face has a warmer bottom band, look at perforated tile placement, underfloor obstructions, or damper settings. If one rack edge glows warmer than its neighbor, check blanking panels, side gaps, cabinet alignment, and cable openings.
This is also where thermal scans help settle arguments. IT says the new servers are fine. Facilities says the row is at the edge. The thermal image shows one missing brush strip behind the exact rack that keeps alarming. Everyone can stop debating the average.
Cold-aisle checks after changes:
Use the thermal image with airflow readings when possible. A balometer or anemometer tells you how much air is coming through a tile. Thermal tells you where that air goes after it leaves the tile. Those are different questions. You need both when a high-density row is eating more power every quarter.
Build the scan route like a maintenance round, not a photo walk. Name the exact objects before you enter the room: UPS-1 front vents, UPS-1 battery cabinets, PDU-A panels, busway taps over Row 3, Rack C01 through C24 fronts, Rack C01 through C24 rears, CRAH-2 supply, CRAH-2 return. The operator should be able to repeat the route in the same order next month without asking what you meant.
Frequency depends on change rate. For a stable enterprise server room, quarterly scans are often enough. For colocation cages, high-density AI rows, or rooms with frequent tenant moves, monthly scans make more sense. Run an extra scan within 24 hours after adding a 30A or 60A whip, replacing a rack PDU, changing containment, moving perforated tiles, or bringing a new dense rack online. Thermal for data center uptime works best when you catch the first abnormal pattern, not the fifth alarm.
A practical route:
Reflections can fool you. Shiny busway covers, polished stainless, glass doors, and glossy cable labels may reflect your body heat or a hot aisle behind you. When a reading matters, change your angle and compare the shape. If the “hot spot” moves when you move, it may be reflection. If it stays locked to the lug, outlet, breaker, or cable bend, take it seriously.
Don’t treat one temperature as universal. A PDU plug, a UPS cabinet vent, a server exhaust, and a cold-aisle rack face all have different normal behavior. Trend and comparison beat isolated numbers. A 95°F server exhaust may be ordinary. A 95°F breaker next to matching 78°F breakers under similar load is a work order.
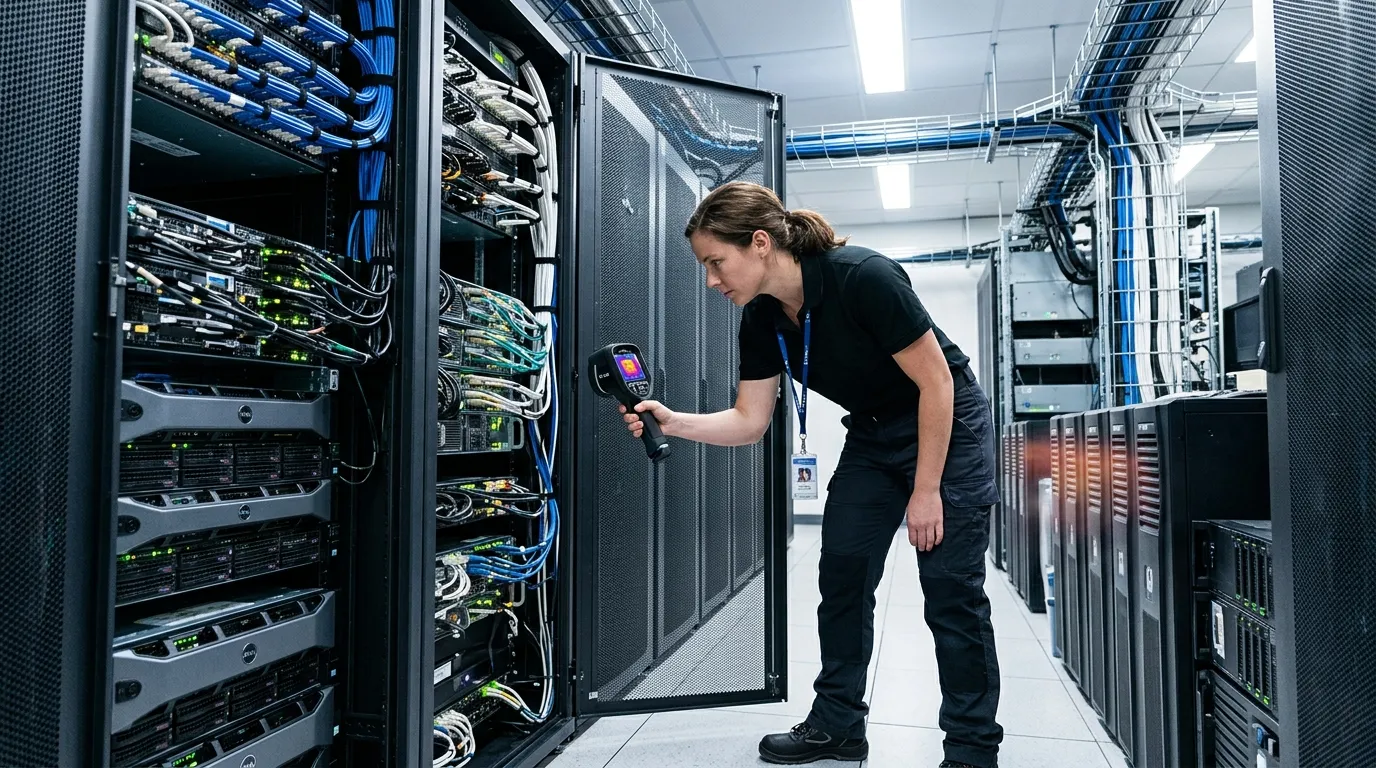
A simple triage model helps operators avoid both panic and apathy. Use it as a starting point, then tune it with your electrical contractor, OEM manuals, and site rules. In most facilities, temperature difference against similar components is more useful than absolute temperature because ambient room conditions and load change through the day.
| Difference From Similar Target | Meaning | Response |
|---|---|---|
| 0°F to 9°F | Usually normal variation | Log and compare next route |
| 10°F to 18°F | Watch item or early fault | Rescan under load, check amps |
| 19°F to 36°F | Likely abnormal condition | Create maintenance ticket |
| Over 36°F | High-risk pattern | Qualified review now |
Thermal imaging also has boundaries. It won’t see through metal cabinets, measure CPU die temperature, confirm liquid coolant flow inside a cold plate, or certify an electrical repair by itself. For liquid-cooled racks with CoolIT, Motivair, or Vertiv CDU systems, thermal scans are best for manifolds, hose connections, rear-door heat exchangers, pumps, and cabinet exterior patterns. Keep using flow, pressure, leak detection, and coolant temperature sensors.
Facilities teams can apply the same pattern discipline outside the data hall. Condensation near humidification lines, chilled-water pipe insulation gaps, and exterior wall temperature anomalies can affect reliability over time; for building-side checks, Pixfra’s guide to detecting hidden moisture & mold risk behind drywall with thermal covers a related inspection method without turning the data center route into a general building audit.
Before your next maintenance window, pick one row and create a baseline set: rack fronts, rack rears, PDUs, UPS, busway, tile pattern, containment edges. Then rescan the same row after the change. The difference between those two sets is where the useful work starts.
Thermal cameras can help prevent outages by finding abnormal heat before failure, especially at PDUs, UPS components, breakers, rack inlets, and airflow gaps. They work best with load readings, maintenance records, and repeat scans.
Run quarterly thermal scans for stable rooms and monthly scans for high-density or fast-changing rows. Always rescan after power changes, rack moves, containment work, tile changes, or new high-load servers.
Scan rack fronts, rack rears, rack PDUs, UPS cabinets, panels, busway taps, cable openings, CRAC/CRAH supply paths, return paths, and containment edges. Prioritize anything that carries load or shapes airflow.
No. Sensors measure specific points, while thermal cameras show patterns across equipment and airflow paths. Use both, especially when a rack alarm doesn’t explain where the heat is coming from.
If you’re building a repeatable route for racks, PDUs, UPS cabinets, and airflow checks, Pixfra can help you choose a handheld thermal camera that fits how your team actually inspects: fast sweeps, clear images, saved evidence, and practical field use during maintenance windows.
Thermal for cold-storage & refrigerated logistics helps you find the warm air paths and insulation defects that make refrigeration systems work harder: torn gaskets, warped doors, wet panels, cracked foam, failed trailer seals, and dock gaps. Use it as a fast building-envelope check, then confirm food temperatures with probes, data loggers, and your normal HACCP or FSMA records.
Thermal for cold-storage & refrigerated logistics is a surface-temperature inspection method for cold rooms, freezers, reefers, and loading docks. It doesn’t prove product safety by itself. It shows where heat is entering, where cold is escaping, and where insulation may be wet, crushed, detached, or bridged by metal.
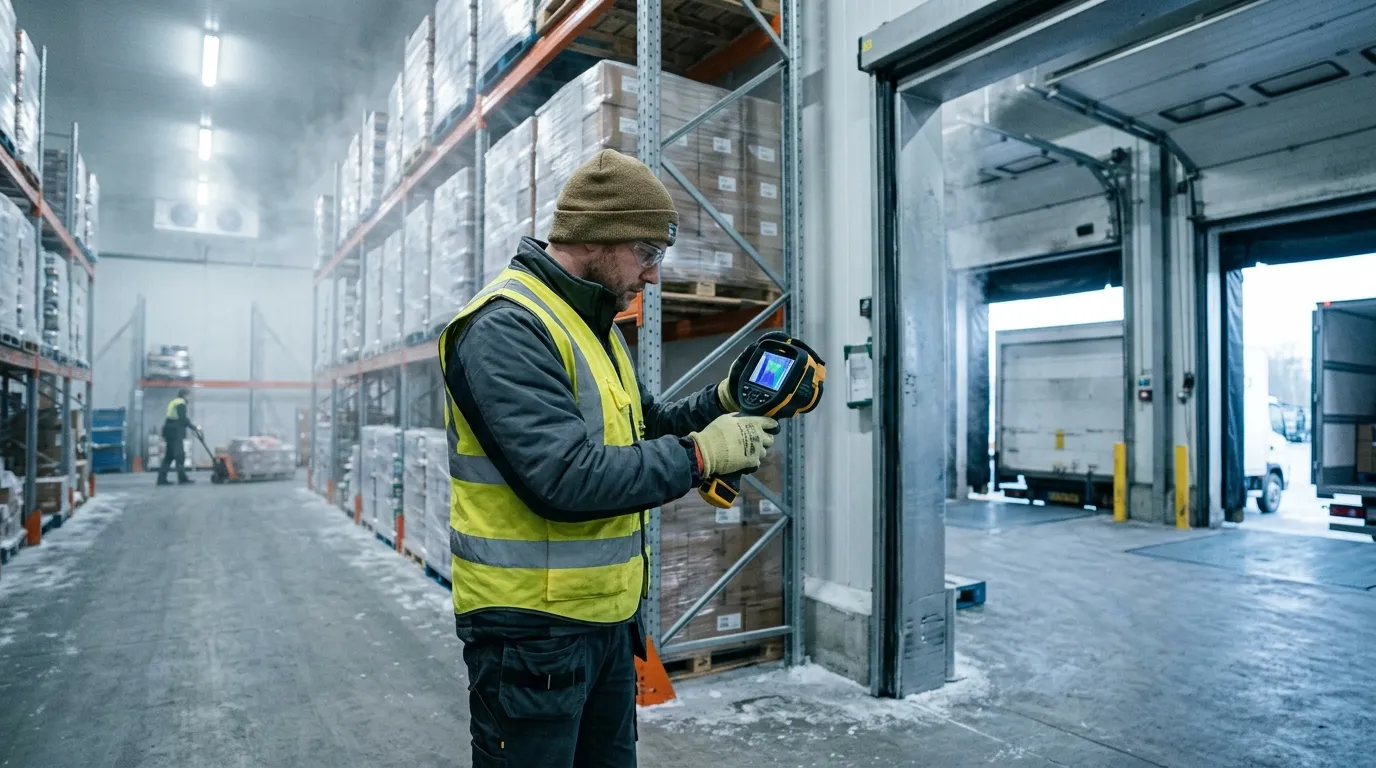
A good scan starts with a temperature difference. If your cooler is at 38°F and the dock is at 72°F, leaks draw themselves on the screen. If the dock and room are both cold after a long winter night, thermal contrast drops and small defects disappear. Wait for a real load condition: doors cycling, evaporators running, forklifts moving, people rushing because the 6 a.m. route is already late.
Use thermal imaging for the shell. Use calibrated contact tools for the food. The FDA Food Code 2022 sets 41°F or less as the cold-holding benchmark for many time/temperature control for safety foods at retail and foodservice, but a thermal camera sees apparent surface temperature. A box of chicken under film wrap, a stainless table, and a shiny trailer liner can all mislead the image.
| Area | Thermal clue | Likely cause | Best follow-up |
|---|---|---|---|
| Door gasket | Thin warm line around edge | Torn vinyl, weak latch, ice buildup | Close on paper strip, adjust latch, replace gasket |
| Panel seam | Warm vertical or ceiling stripe | Failed sealant, foam gap, thermal bridge | Inspect joint, check fasteners, reseal |
| Floor-wall joint | Warm band near cove | Damaged curb, forklift impact, moisture | Probe for water, inspect kick plates |
| Trailer rear doors | Bright edge at hinge side | Worn compression seal, bent door | Check cam locks, hinge pins, gasket crush |
The best time to scan a walk-in freezer is after it has been under load for at least 20 to 30 minutes. You want the system working. A perfectly empty box that has sat closed all night can look clean even when the door sweep leaks during shift change. Scan from inside and outside when you can, because a warm streak visible from the inside may show as a cold plume outside the door.
One small trick helps in cold storage: carry matte tape. Stainless steel, aluminum tread plate, and glossy FRP panels reflect the worker holding the camera. A square of black electrical tape or painter’s tape gives the thermal device a more reliable reference spot. It feels low-tech. It works.
Door problems are the first place to look because they happen every hour. A cold room door may cycle hundreds of times per day, and the gasket takes abuse from pallet jacks, washdown, ice, pressure changes, and impatient shoulders. On a thermal image, a healthy gasket usually shows a clean temperature boundary. A bad gasket shows a bright thread, a feathered plume, or a hot patch near the latch.
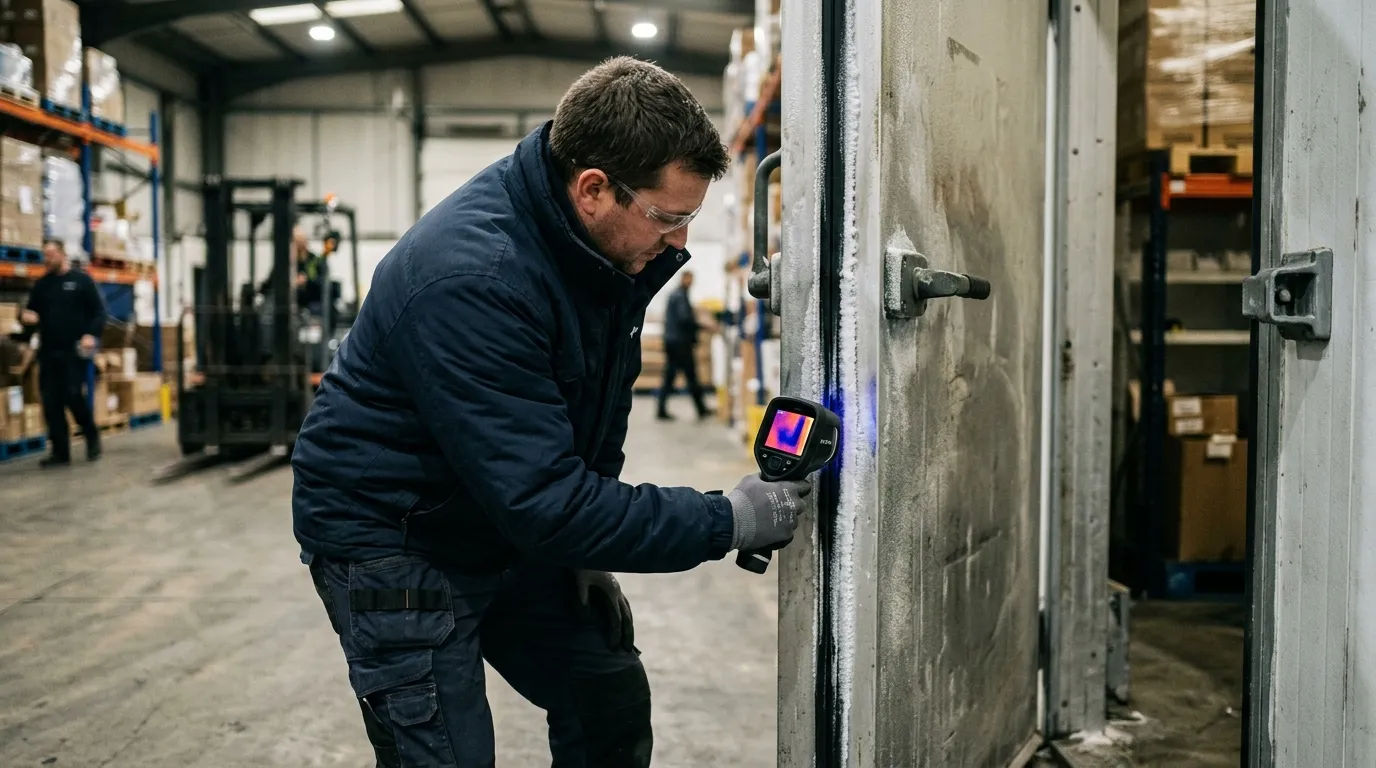
Don’t treat every warm edge the same. A straight warm line around the entire door often points to latch pressure or door alignment. A hot corner near the threshold often points to a torn sweep, floor heave, or ice that stops the gasket from seating. A warm oval at handle height can be nothing more than a handprint from ten seconds ago (annoying, but real).
For refrigerated logistics, rear trailer doors deserve their own scan. A Thermo King Precedent S-750 or Carrier Transicold Vector 8500 can hold setpoint only if the box stops exchanging air with the yard. Scan Utility 3000R, Great Dane Everest, and Wabash refrigerated trailers at the rear frame, hinge side, lower sill, and vent door. The refrigeration unit may be fine; the leak may be a $90 gasket.
Run this quick door test before you blame the refrigeration unit:
A thermal image also helps stop guesswork between operations and maintenance. The operator says, “Freezer 2 won’t recover after lunch.” The technician sees a warm tongue under the roll-up door and a frost ridge on the threshold. Now the repair is specific: replace the bottom seal, inspect the heater wire, and retrain the team to clear ice before the dock rush.
Panel failures are quieter than door leaks. They don’t whistle. They don’t slam. They sit behind product racks and slowly turn electricity into waste. A failed insulated metal panel can show as a warm rectangle, a vertical stripe, or a blotchy area that doesn’t match the panel pattern beside it.
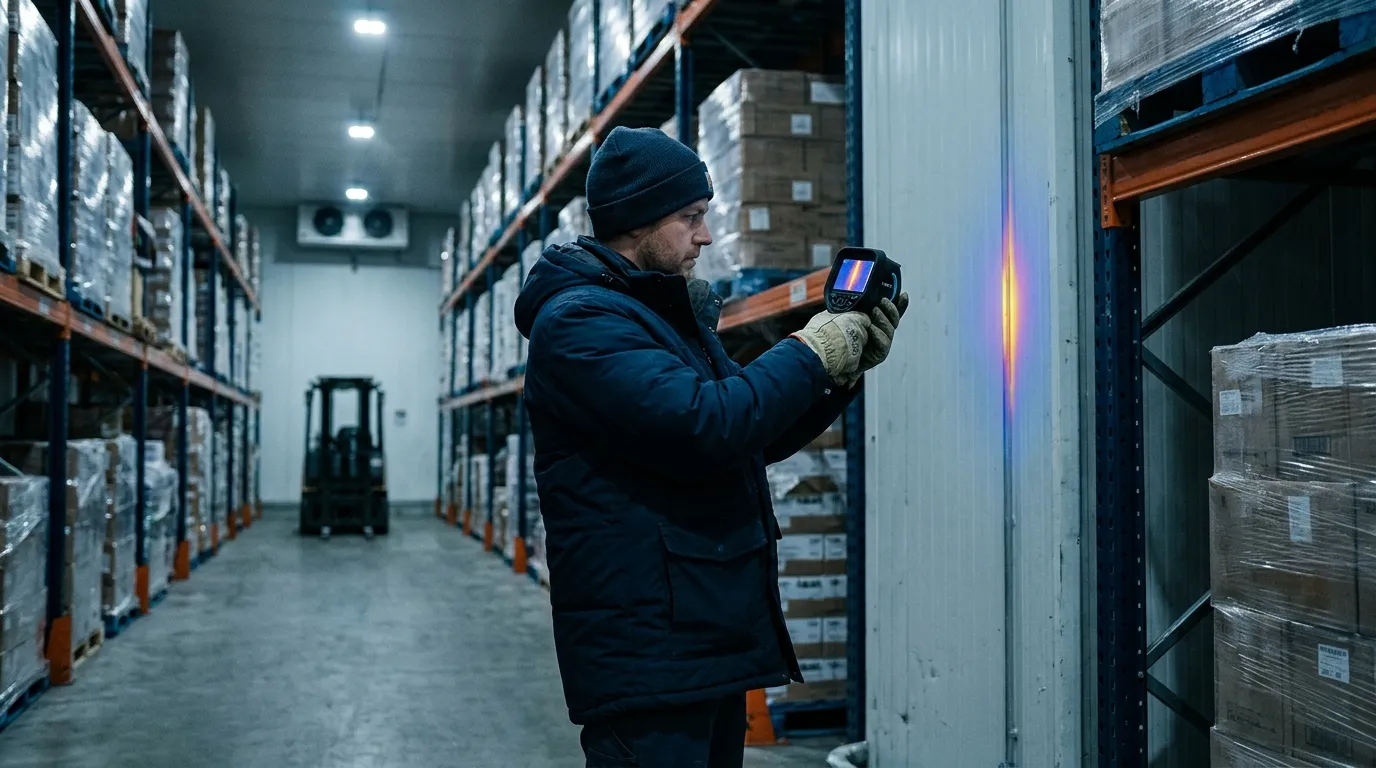
Wet insulation is the ugly version. Once moisture enters foam or mineral wool, the panel loses thermal resistance and can stay wet for months. A thermal scan won’t tell you the moisture percentage, but it can flag the suspect bay. After that, use a pinless moisture meter where the surface allows, inspect penetrations, and check roof drainage. If this is a freezer, look for frost on the warm side too. Frost outside a freezer wall is a bill with a delay.
The same discipline used when plumbers locate slab leaks & radiant heating pipes with thermal applies inside a cold room: you aren’t hunting for the pipe or leak directly every time; you’re reading the pattern left by heat moving through material. Straight lines often mean structure. Soft patches often mean moisture. Repeating marks often mean fasteners or panel geometry.
Panel seams need special attention near evaporators, door frames, pipe penetrations, and electrical conduit. A half-inch unsealed conduit gap can matter more than a scuffed wall panel because moving air carries heat and moisture. Warm air enters, moisture condenses, ice forms, the gap grows, and then the evaporator spends more time removing a problem the wall created.
| Thermal pattern | Common location | Maintenance read | Repair priority |
|---|---|---|---|
| Sharp vertical stripe | Panel joint | Sealant failure or metal bridge | High if near product zone |
| Blotchy warm patch | Wall or ceiling panel | Wet or damaged insulation | High if spreading |
| Warm halo | Pipe or conduit penetration | Air leak around sleeve | Medium to high |
| Repeating dots | Fasteners or clips | Thermal bridging | Low unless condensation appears |
Scan panel seams at a slight angle, then straight on. Move slowly. If the pattern follows your viewing angle, reflection may be fooling you. If the pattern stays fixed on the wall, you probably have a real thermal anomaly. This is where patience beats a dramatic color palette.
Trailers add motion, sunlight, and schedule pressure. A reefer trailer can look fine at the yard and fail on a route after four door openings, one long dwell at a grocery dock, and a driver who parks the rear doors facing afternoon sun. Thermal scanning gives you a pre-trip and post-trip way to catch weak points before they become rejected loads.

Scan before loading, not after product blocks the walls. A clean trailer inspection takes five to seven minutes: rear doors, sidewalls, ceiling, floor channels, bulkhead, drain openings, chute, and unit frame. For multi-temp trailers, scan the bulkhead and movable divider after it is locked. A divider that leaks between frozen and chilled zones can make one zone overwork while the other one drifts.
A practical trailer scan has four data points attached to every image:
| Field | Example entry | Why it matters | Mistake to avoid |
|---|---|---|---|
| Setpoint | 34°F fresh, -10°F frozen | Gives context for thermal contrast | Recording only air temp |
| Ambient | 88°F sunny yard | Explains solar load | Comparing to night scans |
| Trailer ID | Wabash RF-2048 | Ties defect to asset | Using route name only |
| Door state | Closed 10 minutes | Confirms stable condition | Scanning during open-door chaos |
Sidewalls need extra caution in direct sun. Solar gain can paint a warm rectangle that looks like insulation failure. If the sun is hitting the curb side, scan the road side too. Better yet, repeat the scan in shade or indoors. This works better than arguing over one image in a maintenance meeting.
For distribution centers with cold rooms next to offices or dry storage, moisture risk can move beyond the cold envelope. After a gasket leak or wet panel is repaired, the adjacent wall cavity may still need attention; the inspection logic behind detecting hidden moisture & mold risk behind drywall with thermal fits those mixed-use areas well. Cold-chain damage often shows up first as condensation where no one expected condensation.
Thermal imaging also helps during claims. If a receiver rejects a load, your records should include reefer download data, product probe checks, trailer pre-trip notes, and any thermal images from before dispatch. Thermal evidence won’t overrule a failed pulp temperature. It can show whether the box had visible envelope defects before the load left.
Energy waste in cold storage is brutally direct. Heat leaks in. Compressors remove it. You pay twice when moisture rides with the heat, because latent load adds defrost cycles, ice, fan penalties, and labor. ENERGY STAR says certified commercial refrigerators and freezers are on average 20 percent more energy efficient than standard models, but even efficient equipment loses ground when the envelope leaks.
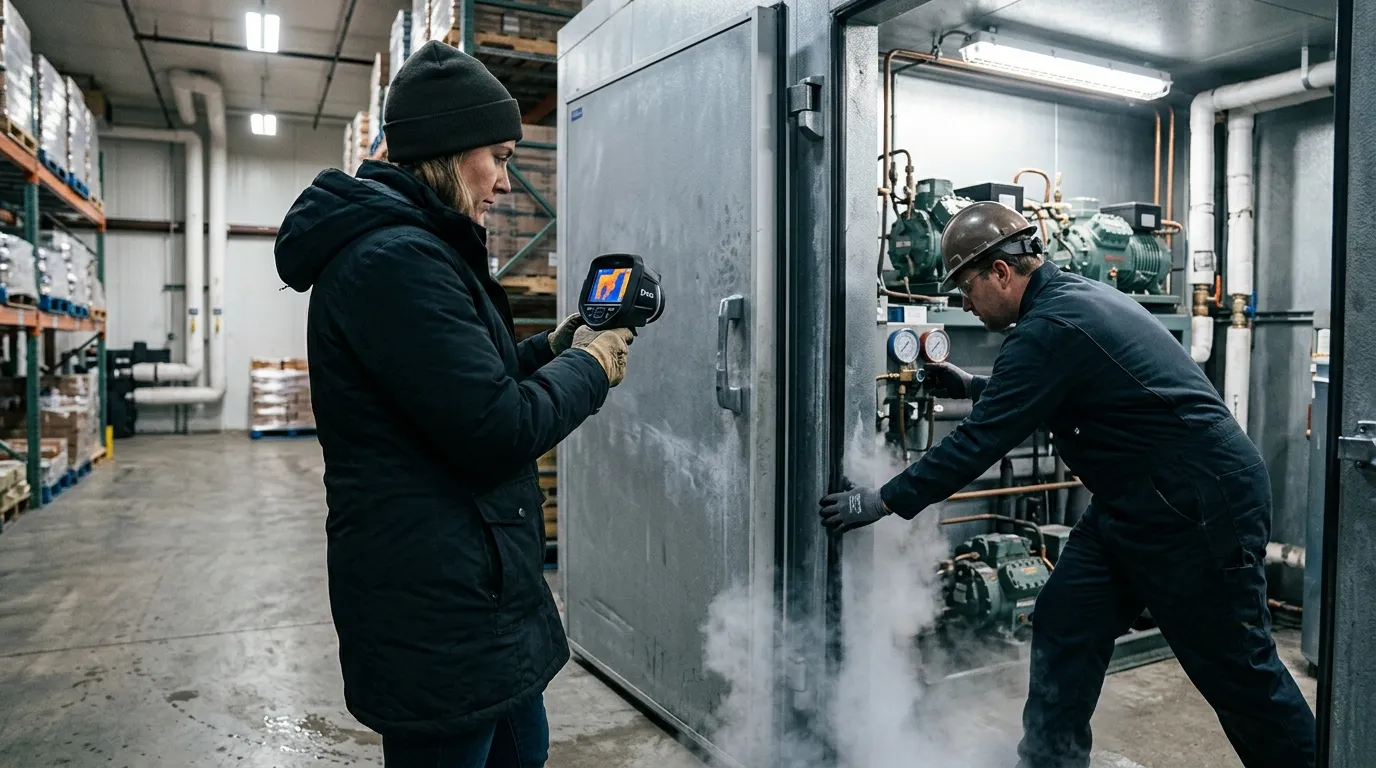
Compliance has a different language. The FDA FSMA Sanitary Transportation final rule, issued in 2016, requires covered shippers, loaders, carriers, and receivers to use practices that keep food safe during transport, including temperature controls when needed. A thermal image isn’t a regulatory temperature record. It is maintenance evidence that supports the control program.
Think of the record package as two folders. Folder one proves product control: calibrated probes, data logger files, reefer downloads, corrective actions, and receiving checks. Folder two proves asset condition: thermal images, gasket work orders, panel repairs, PM logs, and retest photos. Auditors and customers care about folder one first. Folder two explains why folder one stayed clean.
Use this naming format for thermal files:
2026-06-13_Freezer2_DoorA_Inside_0Fset_76Fambient_before.jpg2026-06-13_Freezer2_DoorA_Inside_0Fset_76Fambient_after.jpg2026-06-13_TrailerRF2048_RearDoor_34Fset_88Fambient_pretrip.jpg2026-06-13_Cooler5_CeilingSeam_38Fset_70Fambient_workorder8127.jpgThat level of detail feels fussy until six months later, when a customer asks why their berries warmed during a holiday weekend route. A dated image with setpoint, ambient temperature, trailer ID, and repair note is much easier to defend than “maintenance checked it.”
Don’t use thermal imaging where it doesn’t fit. If the room has no meaningful temperature difference, wait. If the target surface is mirror-like metal, add a matte reference or change your angle. If the question is “Is this pallet safe?”, use product temperature methods. If the question is “Where is heat entering this box?”, thermal earns its place.
Start with the asset list. Pick the rooms and trailers that hurt you most: high door counts, slow pull-down, repeated frost, unusual compressor runtime, rejected loads, or employee complaints about sweating walls. One freezer with a chronic ice ridge deserves attention before ten perfect coolers.
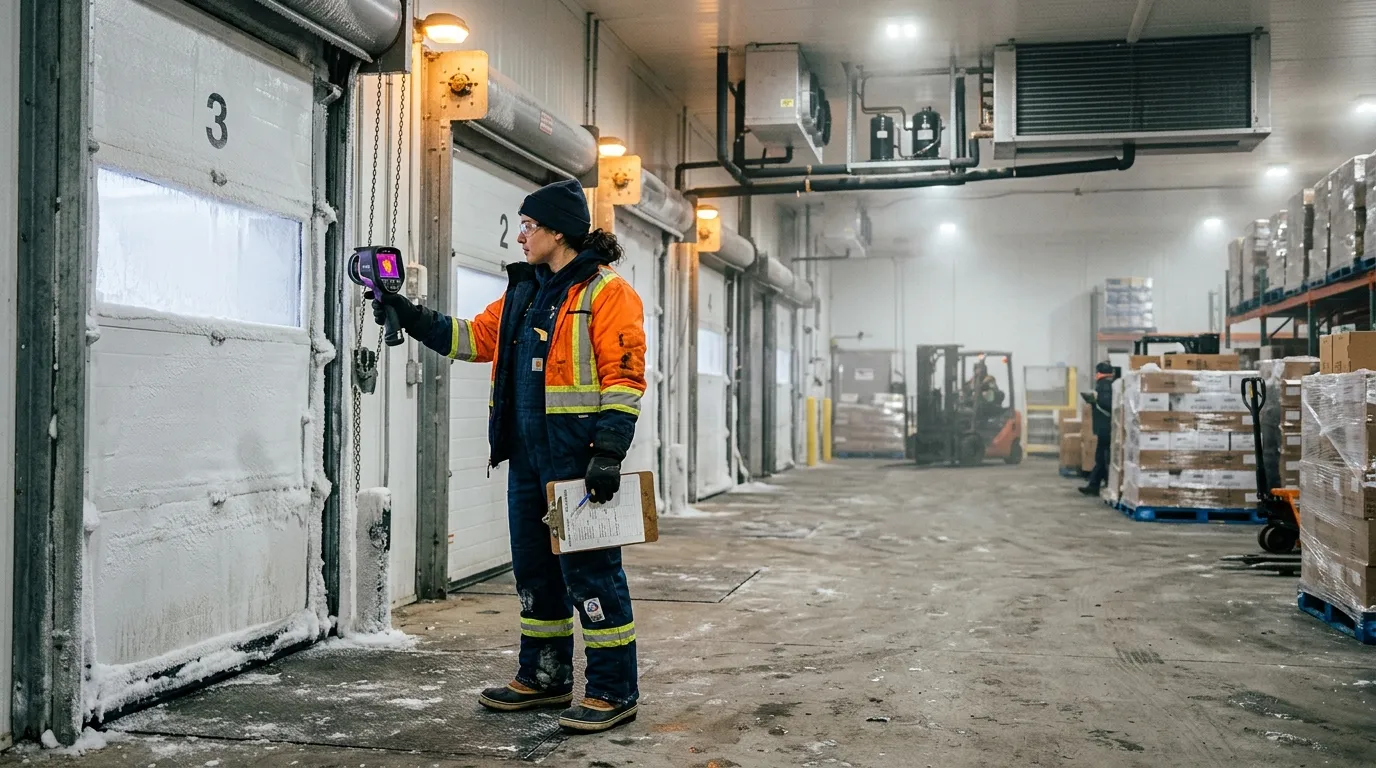
For each asset, scan the same path every time. Consistency beats drama. In a walk-in cooler, start at the main door, move clockwise around wall seams, check penetrations, scan ceiling joints, scan evaporator surrounds, then finish at the floor-wall joint. In a reefer trailer, start at rear doors, move forward along sidewalls, scan the ceiling, check the bulkhead, scan the floor channels, then finish at the unit end.
A good thermal route takes less than 15 minutes per room once the team knows it. The first pass takes longer because you are building the map and naming the assets. After that, the value comes from comparison: before repair, after repair, summer peak, winter baseline, pre-trip, post-trip.
Use a simple scoring method:
| Score | Condition | Action | Retest timing |
|---|---|---|---|
| 1 | Minor bridge, no condensation | Watch list | Next monthly scan |
| 2 | Small air leak or gasket wear | Schedule repair | Within 30 days |
| 3 | Warm seam near product or frost | Repair soon | Within 7 days |
| 4 | Major door leak, wet panel, load risk | Remove from service or restrict use | Same day |
Train two people per shift if possible. Cold-chain inspections fail when only one technician knows the camera and that person is off on inventory day. The scan path should be boring enough that a night-shift lead can repeat it without guessing.
Set the palette to something your team can read quickly. Iron and rainbow palettes make defects pop, but they can exaggerate small differences. Grayscale can be calmer for documentation. Temperature span matters more than palette choice: lock or narrow the span when comparing before-and-after images, or the camera may auto-adjust and make a repaired gasket look unchanged.
No. Thermal imaging shows surface-temperature patterns on doors, panels, floors, and trailer walls. Use calibrated probes, data loggers, and reefer downloads to document product temperature and food safety control.
A 15°F to 25°F difference between the cold space and surrounding area usually gives useful contrast. Bigger differences help, especially around gaskets, panel seams, and trailer rear doors.
Scan parked trailers with doors closed and the reefer running at setpoint. Moving scans are poor for records because airflow, sunlight, vibration, and changing backgrounds can distort the image.
Yes. Stainless steel and glossy liners reflect heat from people, forklifts, lights, and open dock doors. Change the angle or add a small matte tape reference spot before trusting the reading.
Scan high-use doors weekly, refrigerated trailers before peak routes, and full cold rooms monthly. Also scan after gasket replacement, panel repair, forklift impact, water intrusion, or any unexplained pull-down problem.
Before the next dock rush, pick one cooler and run a 12-minute Pixfra scan: door gasket, lower sill, latch side, ceiling seams, pipe penetrations, and floor-wall joint. Save one before image, fix one visible defect, then rescan the same spot under the same setpoint. That single before-and-after pair is the fastest way to turn thermal inspection from a neat picture into a maintenance habit.
